Introduction
This section introduces how to filter the single-cell dataset after running QC metrics or apply subsetting basing on other types of criteria.
Workflow Guide
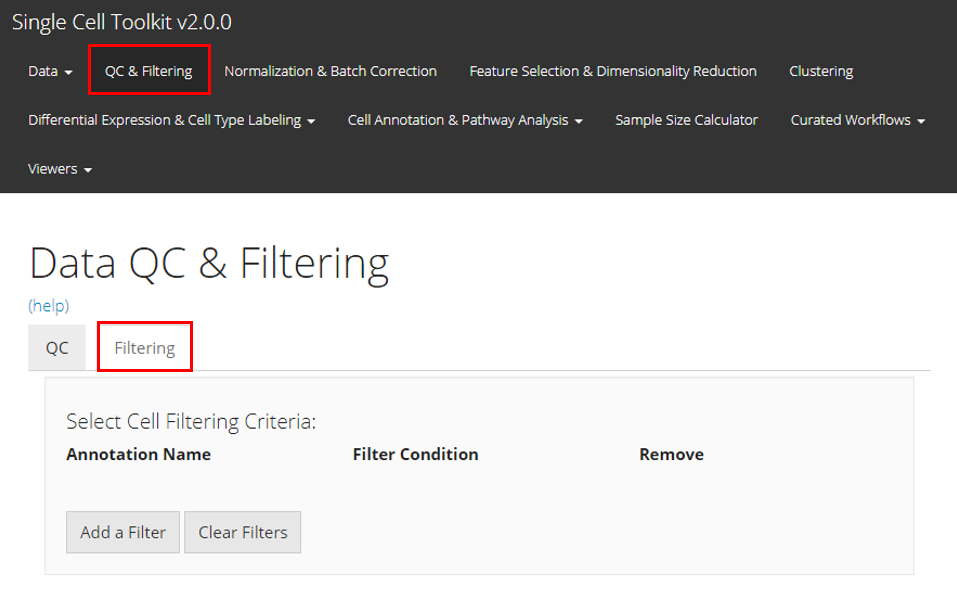
Users should enter this section as instructed by the screenshot above.
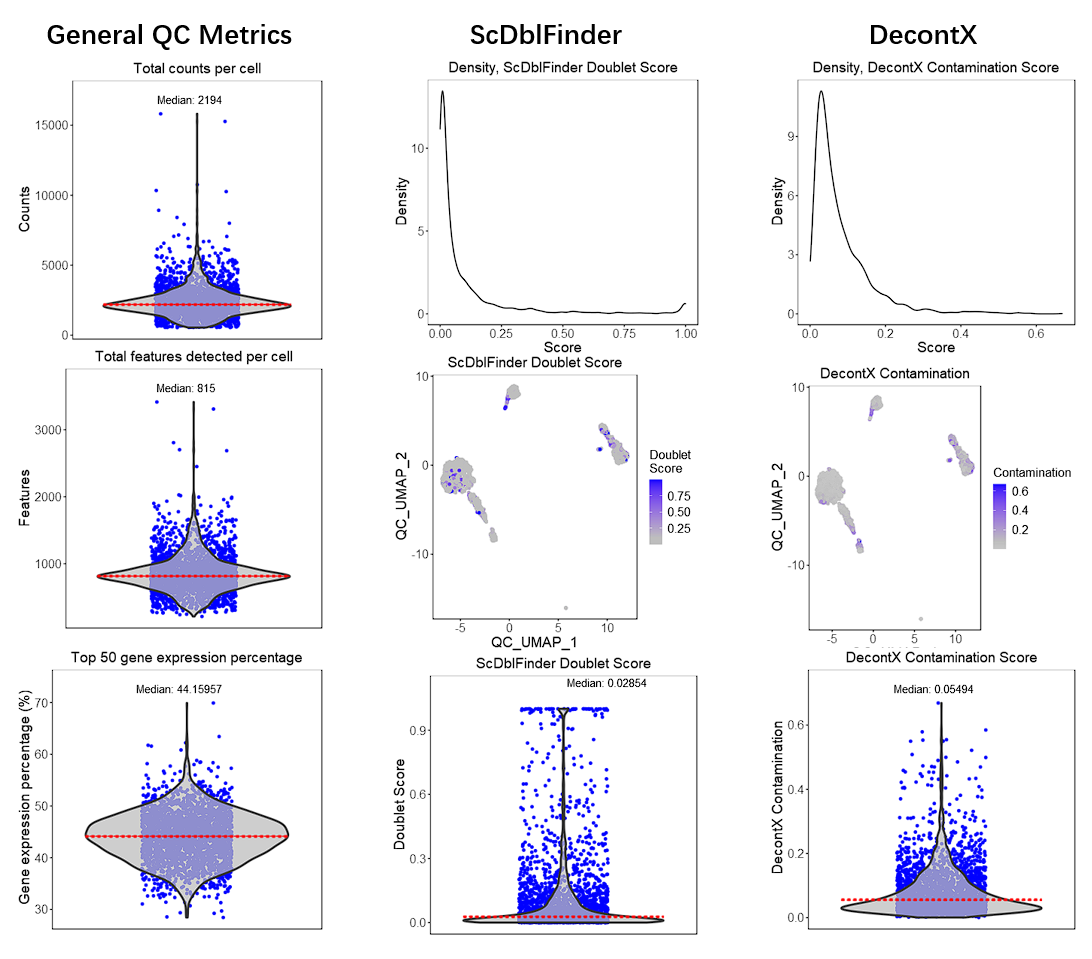
Here we will take the example PBMC3K dataset as an example. We imported this dataset through the “Data” -> “Import Single Cell Data” tab, by selecting “Import example datasets” first and using the default “PBMC 3K (10X)” option then. We next applied three QC methods: General QC metrics, DecontX, and scDblFinder, with all default parameters. Below we will have the plots as generated by SCTK.
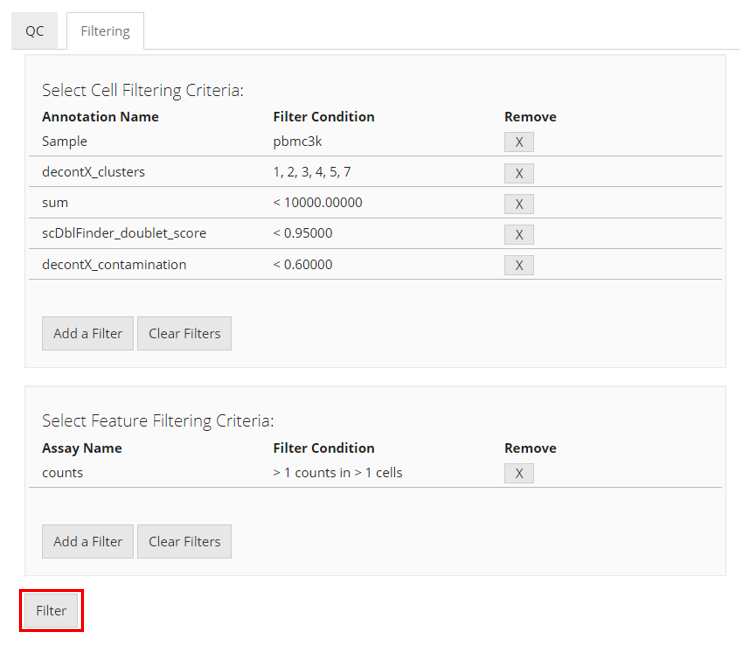
Adding Filters for Cells
To filter by cells, users must click the “Add a
Filter” button in the “Select Cell Filtering
Criteria” panel. A pop-up will appear which asks users to
select by which annotation to filter. Based on that selection, more
input fields will appear for users to specify how they would like to set
the filter.
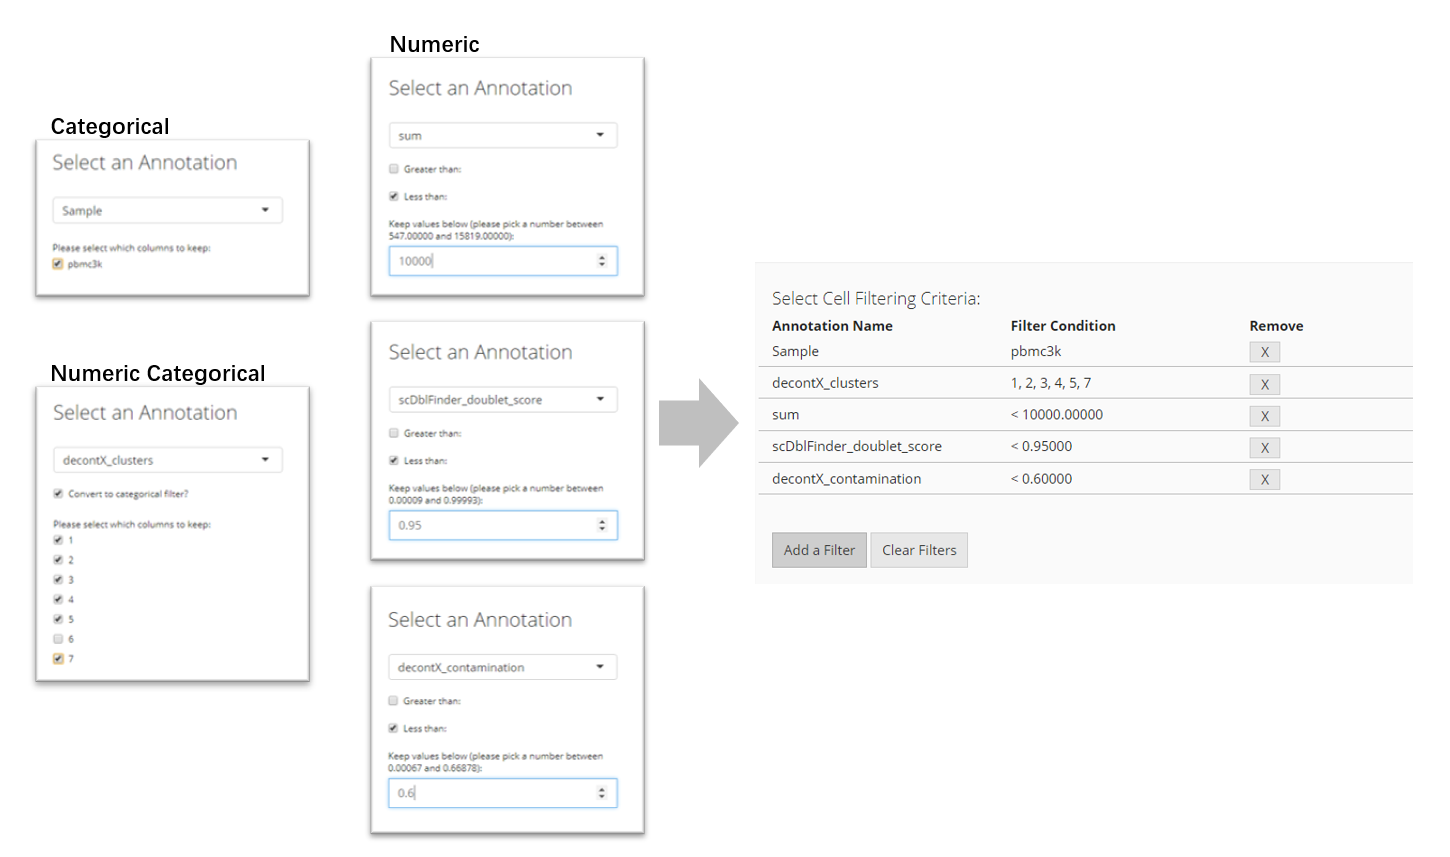
- If the annotation contains categorical information, mostly presented
by text or TRUE/FALSE values, users will have to select which categories
to keep;
- If the annotation contains numeric values that might stand for
categorical information, users will be asked whether to treat them as
categories with a check-box “Convert to categorical
filter”. If users check this, users will have to select which
categories to keep;
- If users do not want to treat the category-like numeric values in the
condition above, or the annotation contains true numeric values, users
will have to set a valid range of value to keep. For keeping cells with
the value greater than a threshold, check “Greater
than” and input the number; for keeping cells with the value
less than a threshold, check “Less than” and input the
number. Users can also check both threshold for double ended range
setting.
After setting each criterion, users have to click on
“OK” button to save it to the criterion table. Users
can again press “Add a Filter” to add more
criteria.
Adding Filters for features
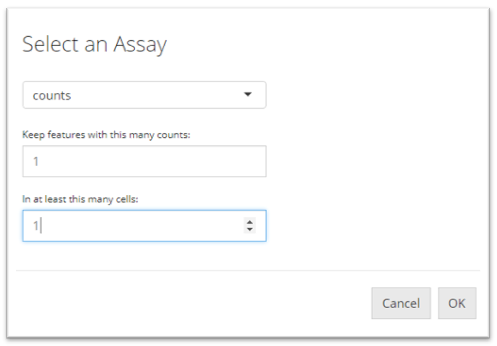
To filter by features, users must click the “Add a Filter” button in the “Select Feature Filtering Criteria” panel. A pop-up will appear which asks users to set the parameters to filter out features. Features are filtered by specifying at least how many counts a gene should be expressed in at least how many cells. Users must first select a expression matrix from the dropdown menu at top of the pop-up. Then, users have to input the numbers in the following numeric fields as explained. To save the the criterion, users must click “OK”.
Applying Filters
Once users have defined all their filtering criteria, the user must click “Filter” to apply the filters to the single-cell dataset.
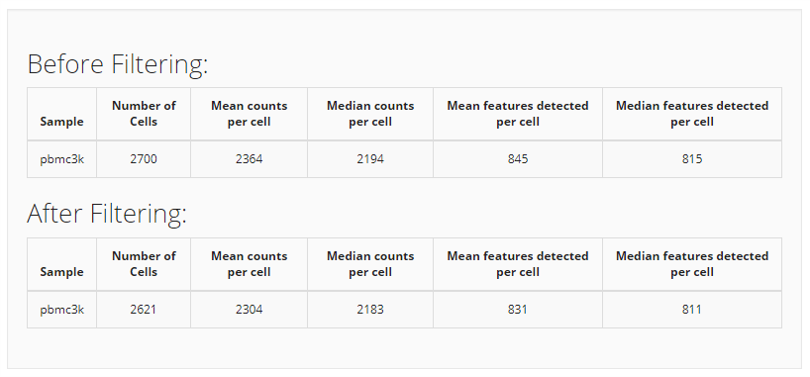
Finally, two tables of the data summary will appear at the bottom for comparing how the filtering works on the dataset.
Single Cell Toolkit (singleCellTK, SCTK) uses SingleCellExperiment
(SCE) object as the basic container of users’ datasets. Users can easily
subset their SCE object with indices inside a suffix bracket.
(e.g. sce[1:10,]) This documentation will skip this type of
operation.
SCTK provides functions that performs filtering/subsetting basing on
colData or rowData, namingly
subsetSCECols() or subsetSCERows(),
respectively. Here we will show some examples.
# Get an SCE object
library(singleCellTK)
sce <- importExampleData("pbmc3k")
sce <- runCellQC(sce, algorithms = "QCMetrics")
## Filter cells basing on multiple columns in `colData` at one time
sce <- subsetSCECols(sce, colData = c("sum < 10000", "detected < 2000"))
For the detail of the arguments, please click on the function name to see the reference page.
Furthermore, in terms of subsetting the features, SCTK allows for
various solution. Users can create subset features of dataset with
subsetSCERows(), by either storing the subset SCE object in
the altExps slot (returnAsAltExp = TRUE) or
treating it as another object. For using the set of highly variable
features/genes (HVG), SCTK store the selection with
rowSubset() (i.e. as a logical vector in
rowData) instead of having a copy of the subset.