Plot heatmap of using data stored in SingleCellExperiment Object
Source:R/plotSCEHeatmap.R
plotSCEHeatmap.RdPlot heatmap of using data stored in SingleCellExperiment Object
plotSCEHeatmap(
  inSCE,
  useAssay = "logcounts",
  doLog = FALSE,
  featureIndex = NULL,
  cellIndex = NULL,
  scale = TRUE,
  trim = c(-2, 2),
  featureIndexBy = "rownames",
  cellIndexBy = "rownames",
  rowDataName = NULL,
  colDataName = NULL,
  featureAnnotations = NULL,
  cellAnnotations = NULL,
  featureAnnotationColor = NULL,
  cellAnnotationColor = NULL,
  rowSplitBy = NULL,
  colSplitBy = NULL,
  rowLabel = FALSE,
  colLabel = FALSE,
  rowLabelSize = 8,
  colLabelSize = 8,
  rowDend = TRUE,
  colDend = TRUE,
  title = NULL,
  rowTitle = "Genes",
  colTitle = "Cells",
  rowGap = grid::unit(0, "mm"),
  colGap = grid::unit(0, "mm"),
  border = FALSE,
  colorScheme = NULL,
  ...
)

plotSCEDimReduceHeatmap(
  inSCE,
  useReducedDim,
  featureIndex = NULL,
  cellIndex = NULL,
  doLog = FALSE,
  scale = FALSE,
  trim = c(-2, 2),
  cellIndexBy = "rownames",
  colDataName = NULL,
  featureAnnotations = NULL,
  cellAnnotations = NULL,
  featureAnnotationColor = NULL,
  cellAnnotationColor = NULL,
  rowSplitBy = NULL,
  colSplitBy = NULL,
  rowLabel = FALSE,
  colLabel = FALSE,
  rowLabelSize = 8,
  colLabelSize = 8,
  rowDend = TRUE,
  colDend = TRUE,
  title = NULL,
  rowTitle = "Dimensions",
  colTitle = "Cells",
  rowGap = grid::unit(0, "mm"),
  colGap = grid::unit(0, "mm"),
  border = FALSE,
  colorScheme = NULL,
  ...
)
Arguments
- inSCE
SingleCellExperiment inherited object.
- useAssay
character. A string indicating the assay name that provides the expression level to plot. Only for
plotSCEHeatmap.- doLog
Logical scalar. Whether to do
log(assay + 1)transformation on the assay indicated byuseAssay. DefaultFALSE.- featureIndex
A vector that can subset the input SCE object by rows (features). Alternatively, it can be a vector identifying features in another feature list indicated by
featureIndexBy. DefaultNULL.- cellIndex
A vector that can subset the input SCE object by columns (cells). Alternatively, it can be a vector identifying cells in another cell list indicated by
featureIndexBy. DefaultNULL.- scale
Whether to perform z-score scaling on each row. Default
TRUE.- trim
A 2-element numeric vector. Values outside of this range will be trimmed to their nearst bound. Default
c(-2, 2)- featureIndexBy
A single character specifying a column name of
rowData(inSCE), or a vector of the same length asnrow(inSCE), where we search for the non-rowname feature indices. Not applicable forplotSCEDimReduceHeatmap. Default"rownames".- cellIndexBy
A single character specifying a column name of
colData(inSCE), or a vector of the same length asncol(inSCE), where we search for the non-rowname cell indices. Default"rownames".- rowDataName
character. The column name(s) in
rowDatathat need to be added to the annotation. Not applicable forplotSCEDimReduceHeatmap. DefaultNULL.- colDataName
character. The column name(s) in
colDatathat need to be added to the annotation. DefaultNULL.- featureAnnotations
data.frame, withrownamescontaining all the features going to be plotted. Character columns should be factors. DefaultNULL.- cellAnnotations
data.frame, withrownamescontaining all the cells going to be plotted. Character columns should be factors. DefaultNULL.- featureAnnotationColor
A named list. Customized color settings for feature labeling. Should match the entries in the
featureAnnotationsorrowDataName. For each entry, there should be a list/vector of colors named with categories. DefaultNULL.- cellAnnotationColor
A named list. Customized color settings for cell labeling. Should match the entries in the
cellAnnotationsorcolDataName. For each entry, there should be a list/vector of colors named with categories. DefaultNULL.- rowSplitBy
character. Do semi-heatmap based on the grouping of this(these) annotation(s). Should exist in either
rowDataNameornames(featureAnnotations). DefaultNULL.- colSplitBy
character. Do semi-heatmap based on the grouping of this(these) annotation(s). Should exist in either
colDataNameornames(cellAnnotations). DefaultNULL.- rowLabel
Use a logical for whether to display all the feature names, a single character to display a column of
rowData(inSCE)annotation, a vector of the same length as full/subsetnrow(inSCE)to display customized info. DefaultFALSE.- colLabel
Use a logical for whether to display all the cell names, a single character to display a column of
colData(inSCE)annotation, a vector of the same length as full/subsetncol(inSCE)to display customized info. DefaultFALSE.- rowLabelSize
A number for the font size of feature names. Default
8- colLabelSize
A number for the font size of cell names. Default
8- rowDend
Whether to display row dendrogram. Default
TRUE.- colDend
Whether to display column dendrogram. Default
TRUE.- title
The main title of the whole plot. Default
NULL.- rowTitle
The subtitle for the rows. Default
"Genes".- colTitle
The subtitle for the columns. Default
"Cells".- rowGap
A numeric value or a
unitobject. For the gap size between rows of the splitted heatmap. Defaultgrid::unit(0, 'mm').- colGap
A numeric value or a
unitobject. For the gap size between columns of the splitted heatmap. Defaultgrid::unit(0, 'mm').- border
A logical scalar. Whether to show the border of the heatmap or splitted heatmaps. Default
TRUE.- colorScheme
function. A function that generates color code by giving a value. Can be generated by
colorRamp2. DefaultNULL.- ...
Other arguments passed to
Heatmap.- useReducedDim
character. A string indicating the reducedDim name that provides the expression level to plot. Only for
plotSCEDimReduceHeatmap.
Value
A ggplot object.
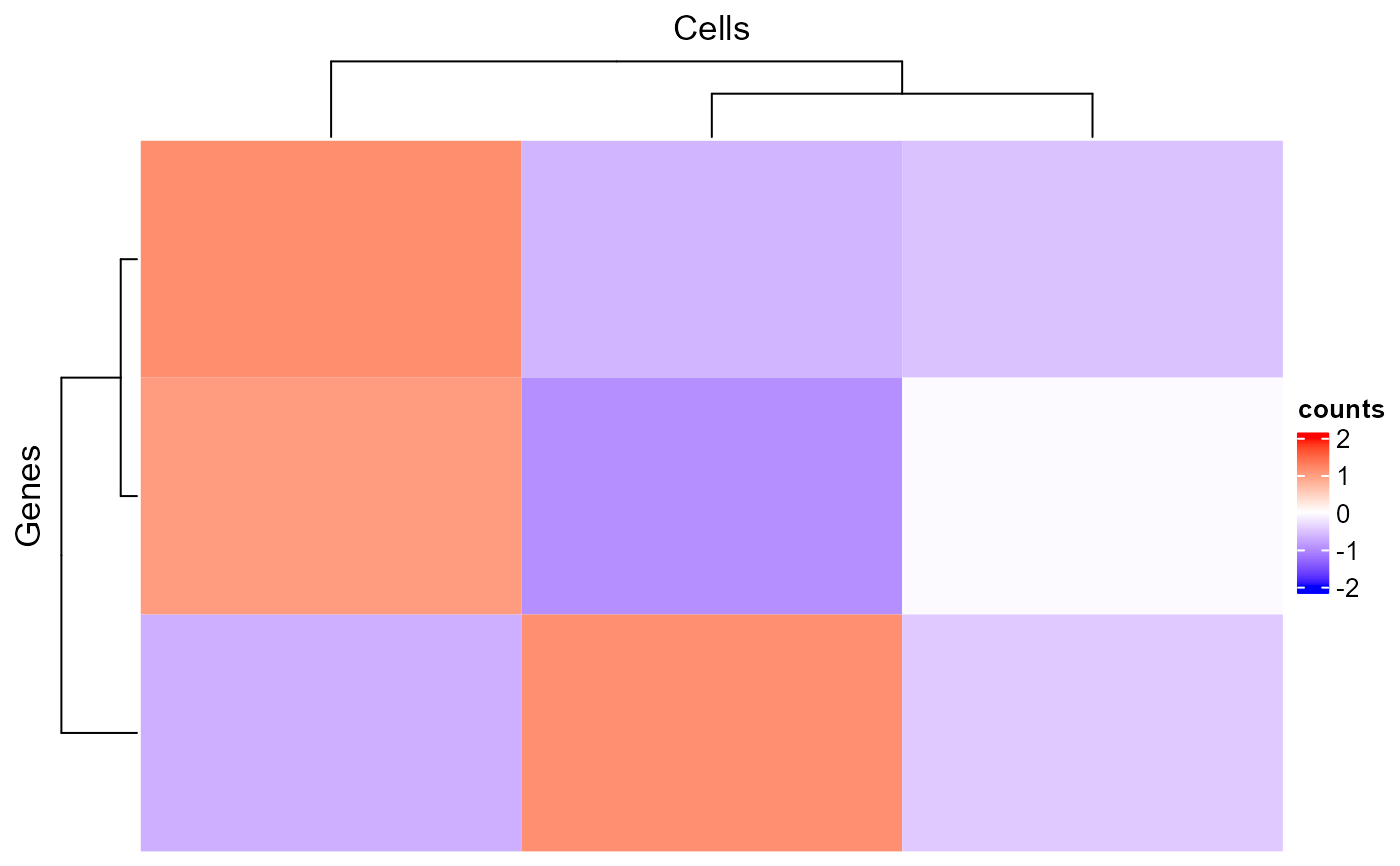
Examples
data(scExample, package = "singleCellTK")
plotSCEHeatmap(sce[1:3,1:3], useAssay = "counts")