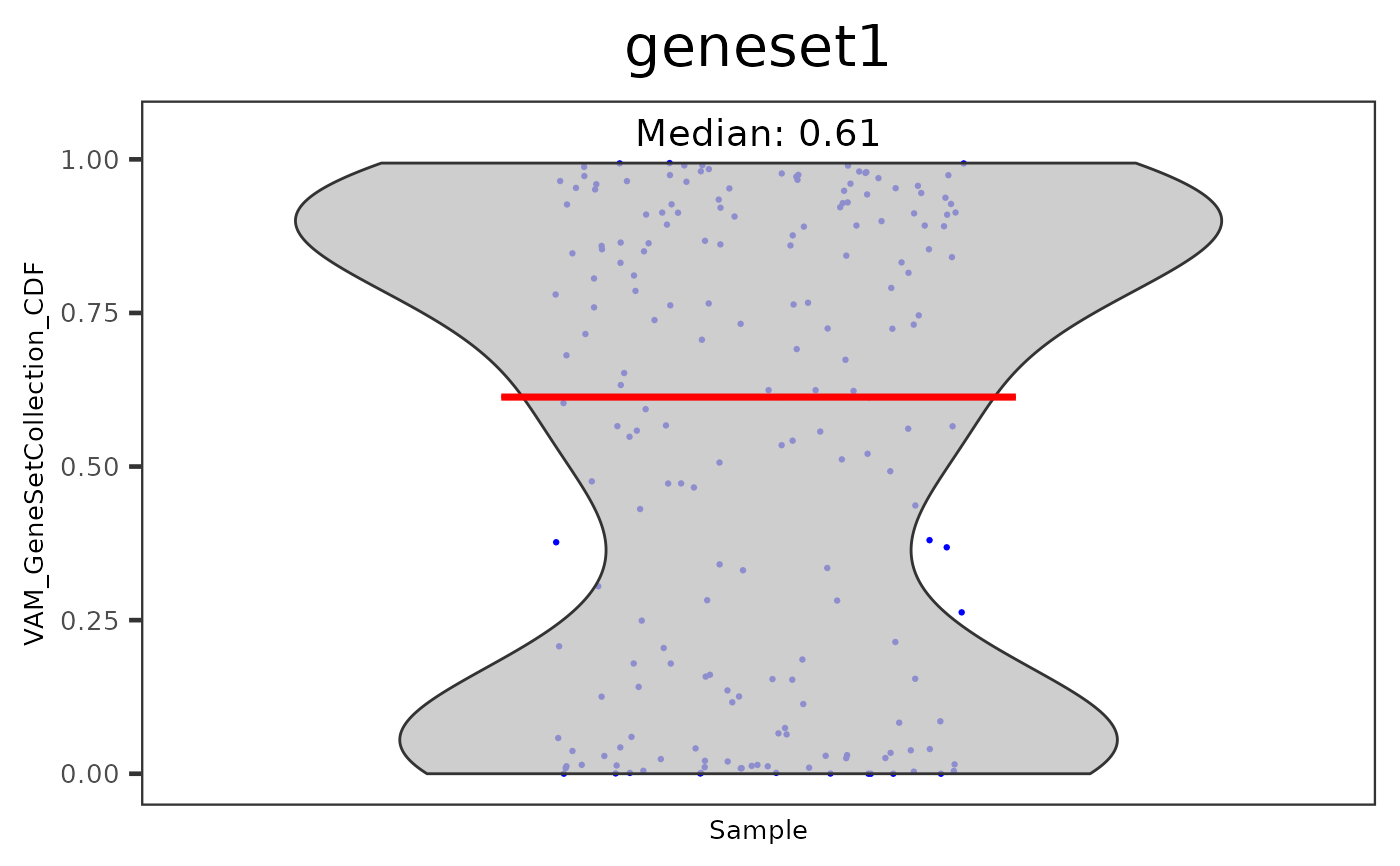
Generate violin plots for pathway analysis results
plotPathway(
  inSCE,
  resultName,
  geneset,
  groupBy = NULL,
  boxplot = FALSE,
  violin = TRUE,
  dots = TRUE,
  summary = "median",
  axisSize = 10,
  axisLabelSize = 10,
  dotSize = 0.5,
  transparency = 1,
  defaultTheme = TRUE,
  gridLine = FALSE,
  title = geneset,
  titleSize = NULL
)
Arguments
- inSCE
Input SingleCellExperiment object. With
runGSVA()orrunVAM()applied in advance.- resultName
A single character of the name of a score matrix, which should be found in
getPathwayResultNames(inSCE).- geneset
A single character specifying the geneset of interest. Should be found in the geneSetCollection used for performing the analysis.
- groupBy
Either a single character specifying a column of
colData(inSCE)or a vector of equal length as the number of cells. DefaultNULL.- boxplot
Boolean, Whether to add a boxplot. Default
FALSE.- violin
Boolean, Whether to add a violin plot. Default
TRUE.- dots
Boolean, If
TRUE, will plot dots for each violin plot. DefaultTRUE.- summary
Adds a summary statistic, as well as a crossbar to the violin plot. Options are
"mean"or"median", andNULLfor not adding. Default"median".- axisSize
Size of x/y-axis ticks. Default
10.- axisLabelSize
Size of x/y-axis labels. Default
10.- dotSize
Size of dots. Default
0.5.- transparency
Transparency of the dots, values will be 0-1. Default
1.- defaultTheme
Removes grid in plot and sets axis title size to
10whenTRUE. DefaultTRUE.- gridLine
Adds a horizontal grid line if
TRUE. Will still be drawn even ifdefaultThemeisTRUE. DefaultFALSE.- title
Title of plot. Default using
geneset.- titleSize
Size of the title of the plot. Default
15.
Value
A ggplot object for the violin plot
Details
runGSVA() or runVAM() should be applied in advance of
using this function. Users can group the data by specifying groupby.
Examples
data("scExample", package = "singleCellTK")
sce <- subsetSCECols(sce, colData = "type != 'EmptyDroplet'")
sce <- scaterlogNormCounts(sce, assayName = "logcounts")
gs1 <- rownames(sce)[seq(10)]
gs2 <- rownames(sce)[seq(11,20)]
gs <- list("geneset1" = gs1, "geneset2" = gs2)
sce <- importGeneSetsFromList(inSCE = sce, geneSetList = gs,
                              by = "rownames")
sce <- runVAM(inSCE = sce, geneSetCollectionName = "GeneSetCollection",
              useAssay = "logcounts")
#> Sat Mar 18 10:29:28 2023 ... Running VAM
#> gene.weights not specified, defaulting all weights to 1
#> Computing VAM distances for 2 gene sets, 195 cells and 200 genes.
#> Min set size: 10, median size: 10
plotPathway(sce, "VAM_GeneSetCollection_CDF", "geneset1")