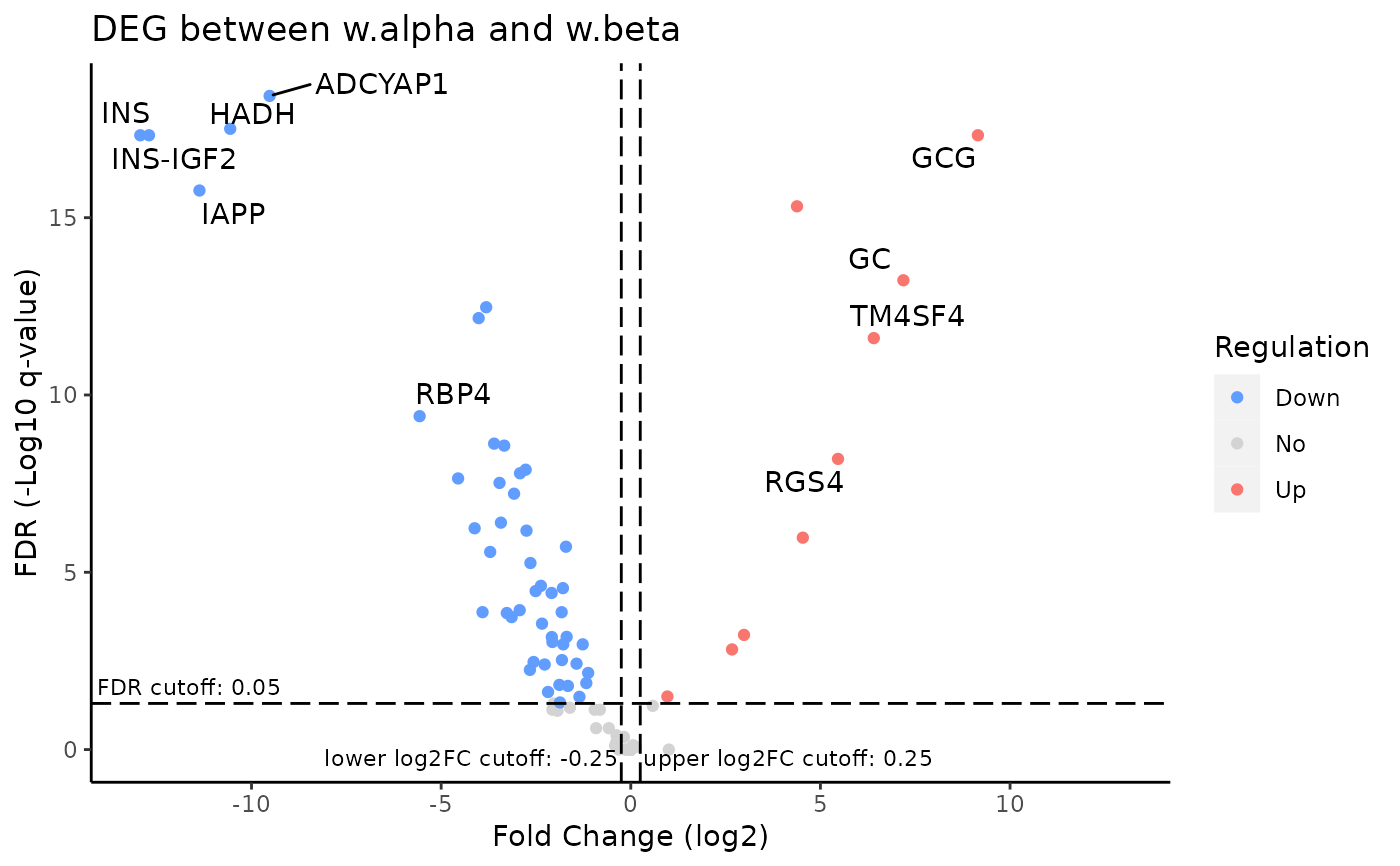
Generate volcano plot for DEGs
plotDEGVolcano(
  inSCE,
  useResult,
  labelTopN = 10,
  log2fcThreshold = 0.25,
  fdrThreshold = 0.05,
  featureDisplay = S4Vectors::metadata(inSCE)$featureDisplay
)
Arguments
- inSCE
SingleCellExperiment inherited object.
- useResult
character. A string specifying the
analysisNameused when running a differential expression analysis function.- labelTopN
Integer, label this number of top DEGs that pass the filters.
FALSEfor not labeling. Default10.- log2fcThreshold
numeric. Label genes with the absolute values of log2FC greater than this value as regulated. Default
0.25.- fdrThreshold
numeric. Label genes with FDR value less than this value as regulated. Default
0.05.- featureDisplay
A character string to indicate a variable in
rowData(inSCE)for feature labeling.NULLfor usingrownames. Defaultmetadata(inSCE)$featureDisplay(seesetSCTKDisplayRow)
Value
A ggplot object of volcano plot
Details
Any of the differential expression analysis method from SCTK should be performed prior to using this function to generate volcano plots.
See also
Examples
data("sceBatches")
sceBatches <- scaterlogNormCounts(sceBatches, "logcounts")
sce.w <- subsetSCECols(sceBatches, colData = "batch == 'w'")
sce.w <- runWilcox(sce.w, class = "cell_type", classGroup1 = "alpha",
                   groupName1 = "w.alpha", groupName2 = "w.beta",
                   analysisName = "w.aVSb")
#> Sat Mar 18 10:28:48 2023 ... Running DE with wilcox, Analysis name: w.aVSb
plotDEGVolcano(sce.w, "w.aVSb")