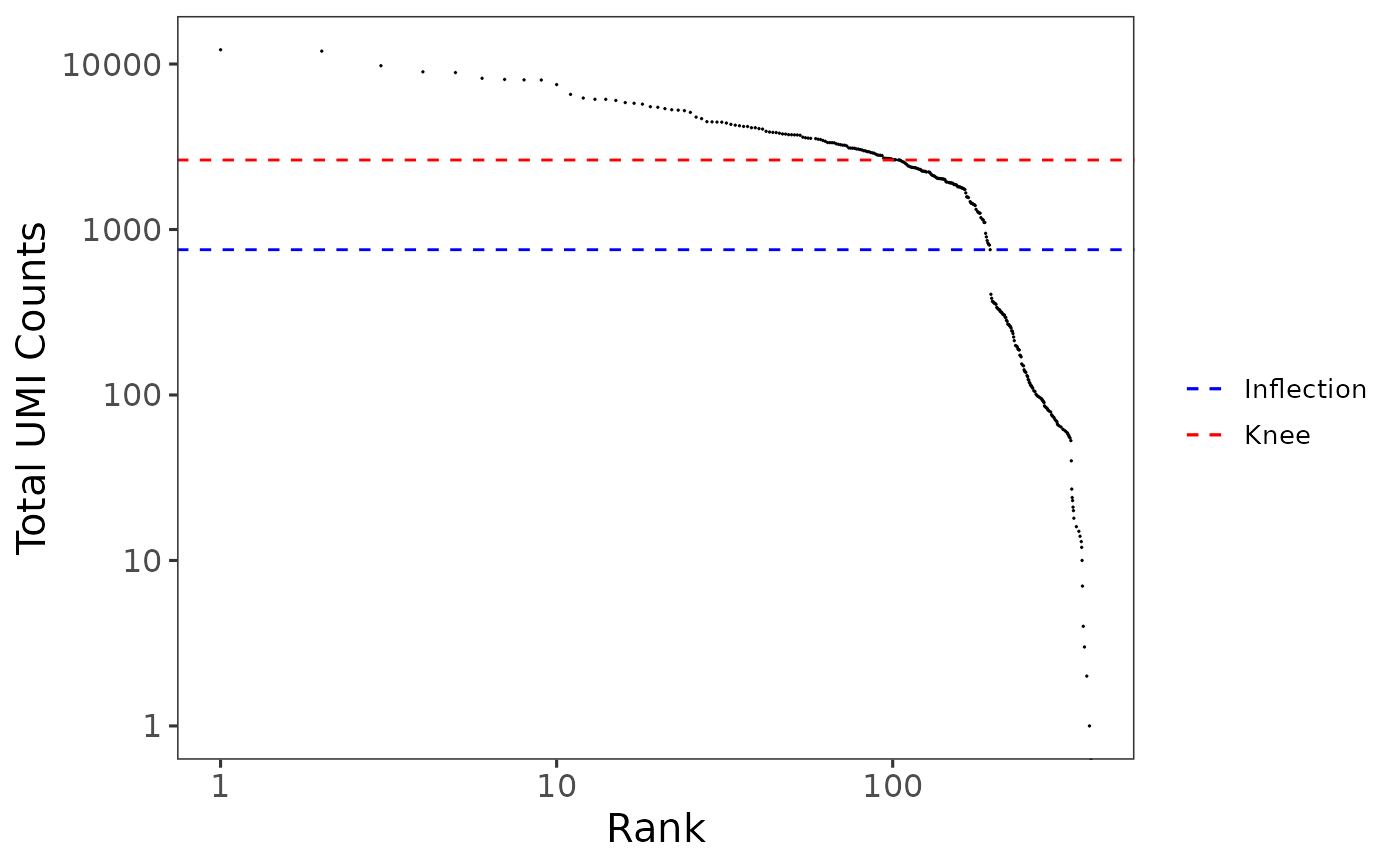
A plotting function which visualizes outputs from the runBarcodeRankDrops function stored in the colData slot of the SingleCellExperiment object via scatterplot.
plotBarcodeRankScatter(
  inSCE,
  sample = NULL,
  defaultTheme = TRUE,
  dotSize = 0.1,
  title = NULL,
  titleSize = 18,
  xlab = NULL,
  ylab = NULL,
  axisSize = 12,
  axisLabelSize = 15,
  legendSize = 10,
  combinePlot = "none",
  sampleRelHeights = 1,
  sampleRelWidths = 1
)
Arguments
- inSCE
Input SingleCellExperiment object with saved dimension reduction components or a variable with saved results from
runBarcodeRankDrops. Required.- sample
Character vector or colData variable name. Indicates which sample each cell belongs to. Default
NULL.- defaultTheme
Removes grid in plot and sets axis title size to
10whenTRUE. DefaultTRUE.- dotSize
Size of dots. Default
0.1.- title
Title of plot. Default
NULL.- titleSize
Size of title of plot. Default
18.- xlab
Character vector. Label for x-axis. Default
NULL.- ylab
Character vector. Label for y-axis. Default
NULL.- axisSize
Size of x/y-axis ticks. Default
12.- axisLabelSize
Size of x/y-axis labels. Default
15.- legendSize
size of legend. Default
10.- combinePlot
Must be either
"all","sample", or"none"."all"will combine all plots into a single .ggplot object, while"sample"will output a list of plots separated by sample. Default"all".- sampleRelHeights
If there are multiple samples and combining by
"all", the relative heights for each plot. Default1.- sampleRelWidths
If there are multiple samples and combining by
"all", the relative widths for each plot. Default1.
Value
a ggplot object of the scatter plot.
Examples
data(scExample, package = "singleCellTK")
sce <- runBarcodeRankDrops(inSCE = sce)
#> Sat Mar 18 10:28:20 2023 ... Running 'barcodeRanks'
plotBarcodeRankScatter(inSCE = sce)
#> Warning: Transformation introduced infinite values in continuous y-axis