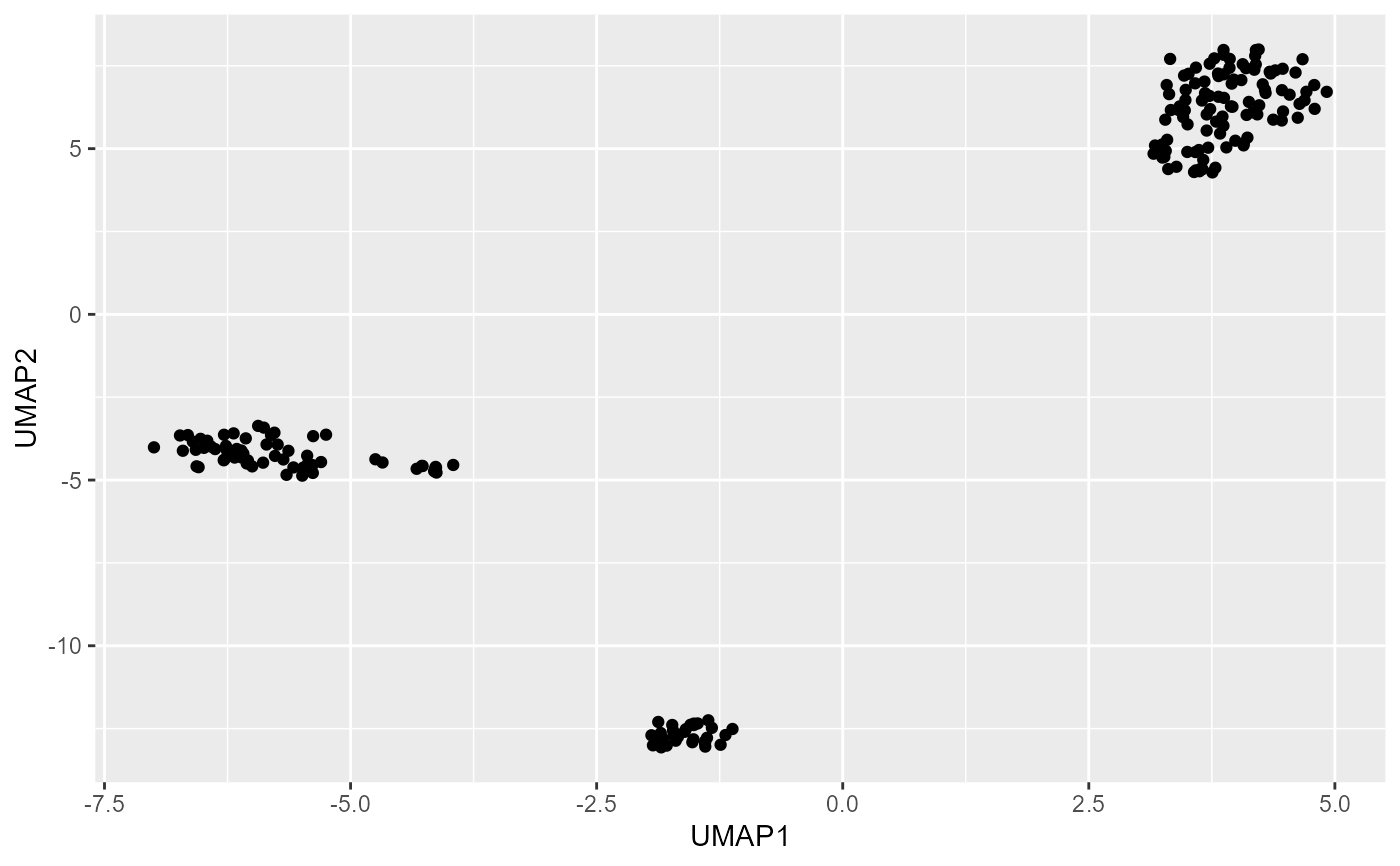
Plot UMAP results either on already run results or run first and then plot.
Source:R/plotUMAP.R
plotUMAP.RdPlot UMAP results either on already run results or run first and then plot.
plotUMAP(
  inSCE,
  colorBy = "No Color",
  shape = "No Shape",
  reducedDimName = "UMAP",
  runUMAP = FALSE,
  useAssay = "logcounts"
)
Arguments
- inSCE
Input SingleCellExperiment object with saved dimension reduction components. Required
- colorBy
color by a condition(any column of the annotation data).
- shape
add shapes to each condition.
- reducedDimName
saved dimension reduction name in the SingleCellExperiment object. Required.
- runUMAP
If the dimension reduction components are already available set this to FALSE, otherwise set to TRUE. Default is False.
- useAssay
Indicate which assay to use. The default is "logcounts"
Value
a UMAP plot of the reduced dimensions.
Examples
data(scExample, package = "singleCellTK")
sce <- subsetSCECols(sce, colData = "type != 'EmptyDroplet'")
sce <- getUMAP(inSCE = sce, useAssay = "counts", reducedDimName = "UMAP")
#> Found more than one class "dist" in cache; using the first, from namespace 'BiocGenerics'
#> Also defined by 'spam'
#> Found more than one class "dist" in cache; using the first, from namespace 'BiocGenerics'
#> Also defined by 'spam'
#> Found more than one class "dist" in cache; using the first, from namespace 'BiocGenerics'
#> Also defined by 'spam'
plotUMAP(sce, shape = "No Shape", reducedDimName = "UMAP",
         runUMAP = TRUE, useAssay = "counts")