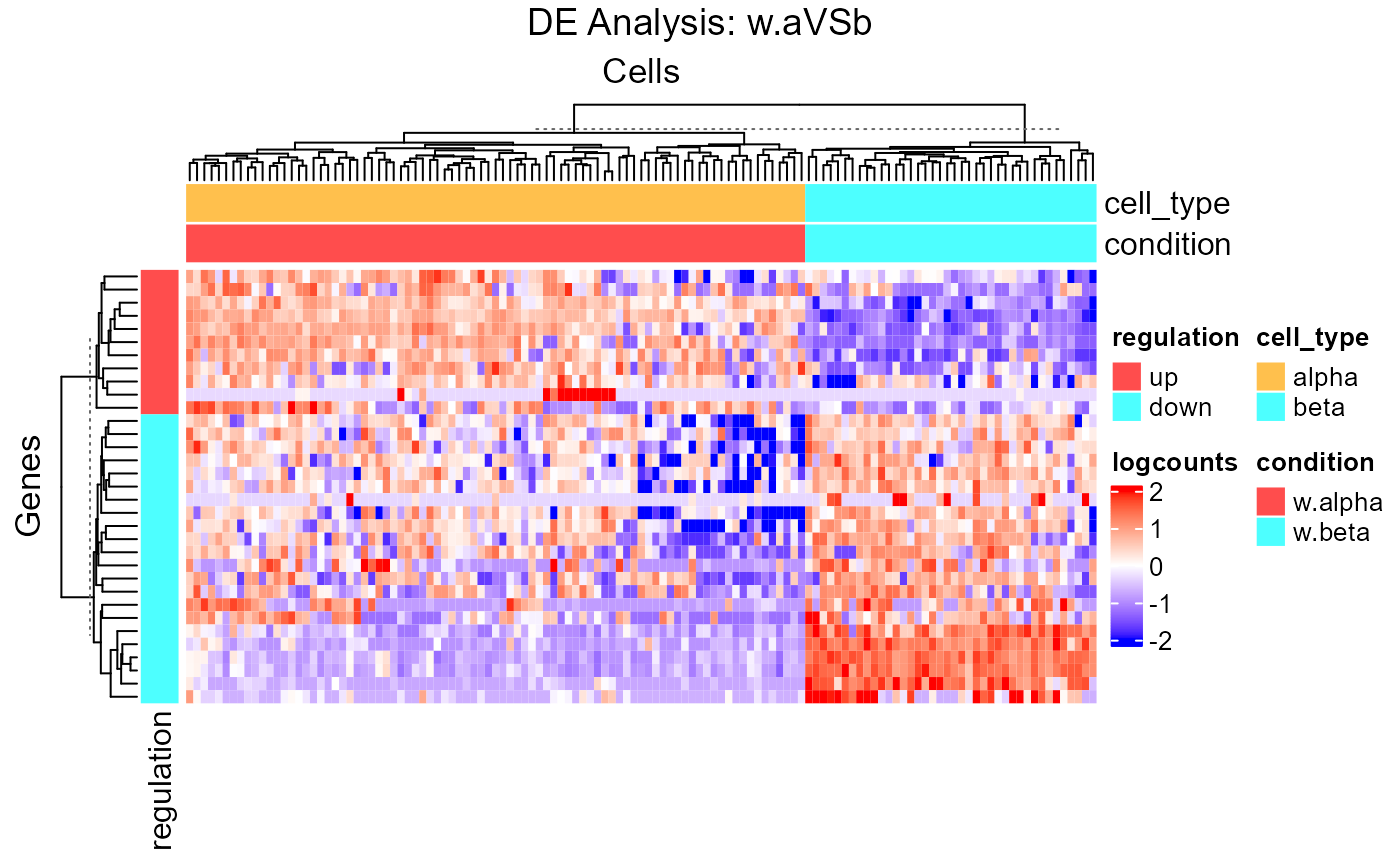
Heatmap visualization of DEG result
plotDEGHeatmap(
  inSCE,
  useResult,
  doLog = FALSE,
  onlyPos = FALSE,
  log2fcThreshold = 0.25,
  fdrThreshold = 0.05,
  useAssay = NULL,
  featureAnnotations = NULL,
  cellAnnotations = NULL,
  featureAnnotationColor = NULL,
  cellAnnotationColor = NULL,
  rowDataName = NULL,
  colDataName = NULL,
  colSplitBy = "condition",
  rowSplitBy = "regulation",
  title = paste0("DE Analysis: ", useResult),
  ...
)
Arguments
- inSCE
SingleCellExperiment inherited object.
- useResult
character. A string specifying the
analysisNameused when running a differential expression analysis function.- doLog
Logical scalar. Whether to do
log(assay + 1)transformation on the assay used for the analysis. DefaultFALSE.- onlyPos
logical. Whether to only plot DEG with positive log2_FC value. Default
FALSE.- log2fcThreshold
numeric. Only plot DEGs with the absolute values of log2FC larger than this value. Default
0.25.- fdrThreshold
numeric. Only plot DEGs with FDR value smaller than this value. Default
0.05.- useAssay
character. A string specifying an assay of expression value to plot. By default the assay used for
runMAST()will be used. DefaultNULL.- featureAnnotations
data.frame, withrownamescontaining all the features going to be plotted. Character columns should be factors. DefaultNULL.- cellAnnotations
data.frame, withrownamescontaining all the cells going to be plotted. Character columns should be factors. DefaultNULL.- featureAnnotationColor
A named list. Customized color settings for feature labeling. Should match the entries in the
featureAnnotationsorrowDataName. For each entry, there should be a list/vector of colors named with categories. DefaultNULL.- cellAnnotationColor
A named list. Customized color settings for cell labeling. Should match the entries in the
cellAnnotationsorcolDataName. For each entry, there should be a list/vector of colors named with categories. DefaultNULL.- rowDataName
character. The column name(s) in
rowDatathat need to be added to the annotation. DefaultNULL.- colDataName
character. The column name(s) in
colDatathat need to be added to the annotation. DefaultNULL.- colSplitBy
character. Do semi-heatmap based on the grouping of this(these) annotation(s). Should exist in either
colDataNameornames(cellAnnotations). Default"condition".- rowSplitBy
character. Do semi-heatmap based on the grouping of this(these) annotation(s). Should exist in either
rowDataNameornames(featureAnnotations). Default"regulation".- title
character. Main title of the heatmap. Default
"DE Analysis: <useResult>".- ...
Other arguments passed to
plotSCEHeatmap
Value
A ComplexHeatmap::Heatmap object
Details
A differential expression analysis function has to be run in advance
so that information is stored in the metadata of the input SCE object. This
function wraps plotSCEHeatmap.
A feature annotation basing on the log2FC level called "regulation"
will be automatically added. A cell annotation basing on the condition
selection while running the analysis called "condition", and the
annotations used from colData(inSCE) while setting the condition and
covariates will also be added.
Examples
data("sceBatches")
logcounts(sceBatches) <- log(counts(sceBatches) + 1)
sce.w <- subsetSCECols(sceBatches, colData = "batch == 'w'")
sce.w <- runWilcox(sce.w, class = "cell_type", classGroup1 = "alpha",
                   groupName1 = "w.alpha", groupName2 = "w.beta",
                   analysisName = "w.aVSb")
plotDEGHeatmap(sce.w, "w.aVSb")