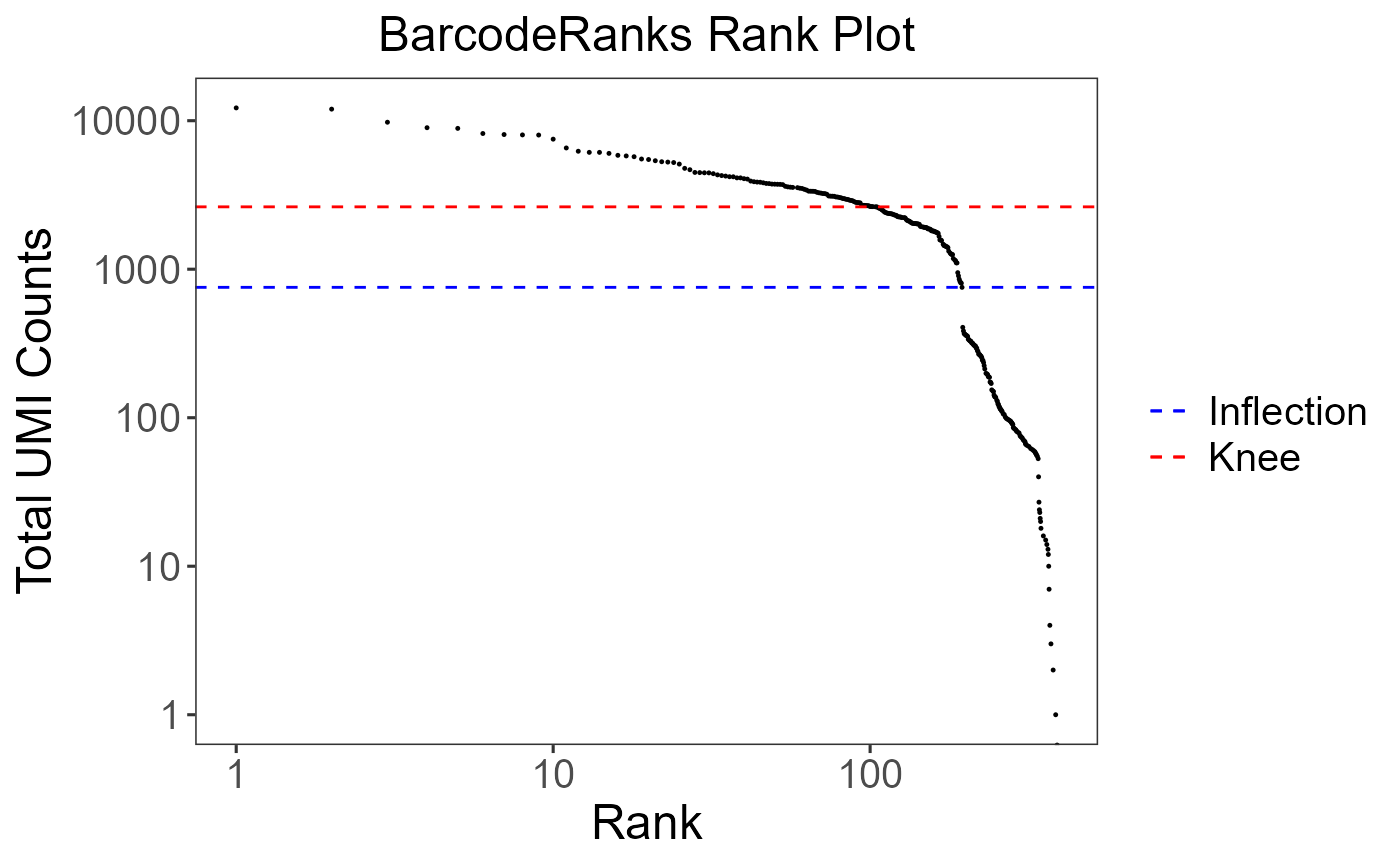
A wrapper function which visualizes outputs from the runEmptyDrops function stored in the colData slot of the SingleCellExperiment object via plots.
plotBarcodeRankDropsResults(
  inSCE,
  sample = NULL,
  defaultTheme = TRUE,
  dotSize = 0.5,
  titleSize = 18,
  axisLabelSize = 18,
  axisSize = 15,
  legendSize = 15
)
Arguments
- inSCE
Input SingleCellExperiment object with saved dimension reduction components or a variable with saved results from runBarcodeRankDrops. Required.
- sample
Character vector. Indicates which sample each cell belongs to. Default NULL.
- defaultTheme
Removes grid in plot and sets axis title size to 10 when TRUE. Default TRUE.
- dotSize
Size of dots. Default 0.5.
- titleSize
Size of title of plot. Default 18.
- axisLabelSize
Size of x/y-axis labels. Default 18.
- axisSize
Size of x/y-axis ticks. Default 15.
- legendSize
size of legend. Default 15.
Value
list of .ggplot objects
Examples
data(scExample, package="singleCellTK")
sce <- runBarcodeRankDrops(inSCE=sce)
#> Thu Mar 31 12:08:31 2022 ... Running 'barcodeRanks'
plotBarcodeRankDropsResults(inSCE=sce)
#> $scatterBarcodeRank
#> Warning: Transformation introduced infinite values in continuous y-axis

#>
#>