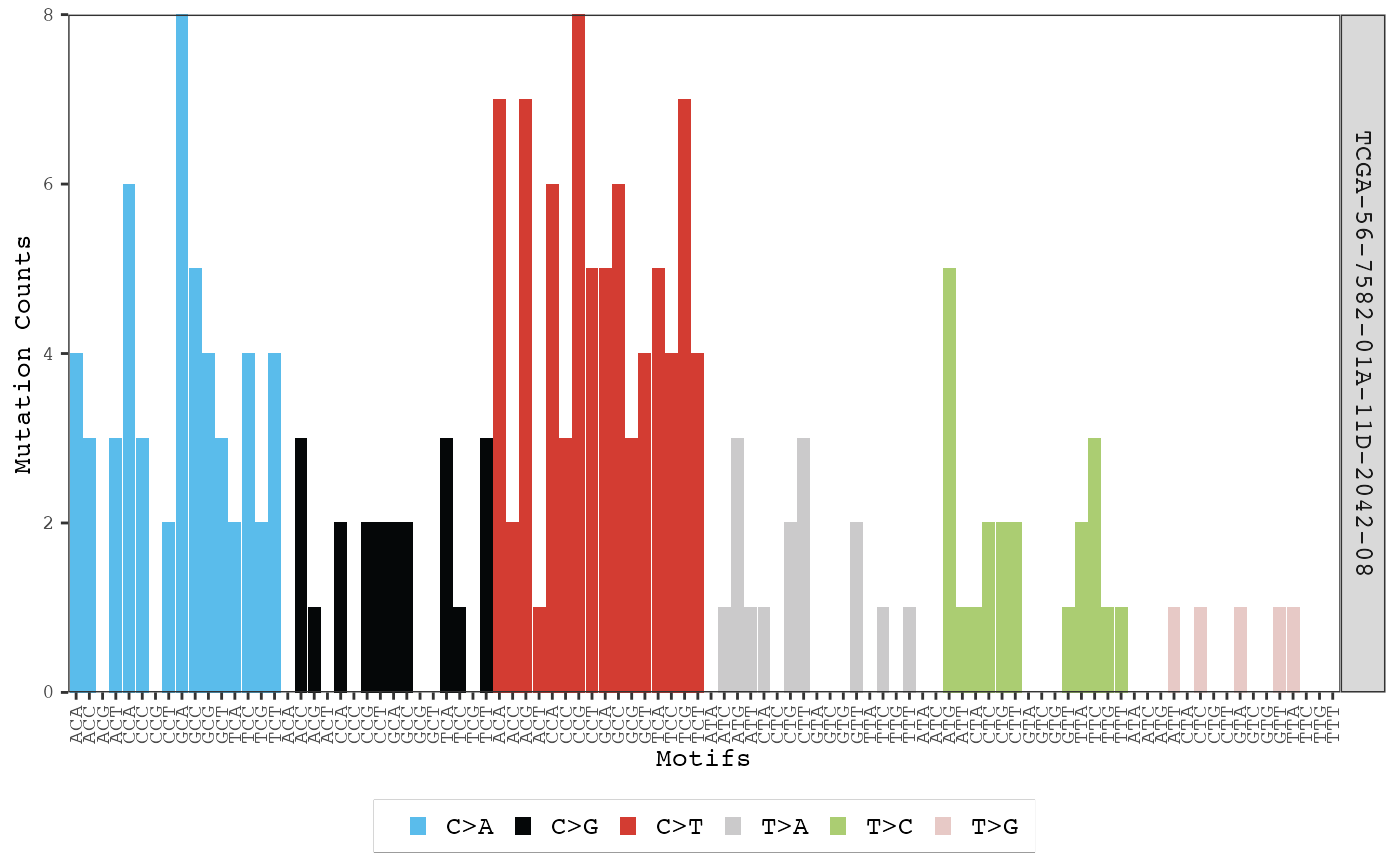
Displays the proportion of counts for each mutation type across one or more samples.
plot_sample_counts(musica, sample_names, table_name = NULL)
Arguments
| musica | A |
|---|---|
| sample_names | Names of the samples to plot. |
| table_name | Name of table used for plotting counts. If |
Value
Generates a ggplot object