Plotting Celda module probability on a dimension reduction plot
Source:R/plot_dr.R
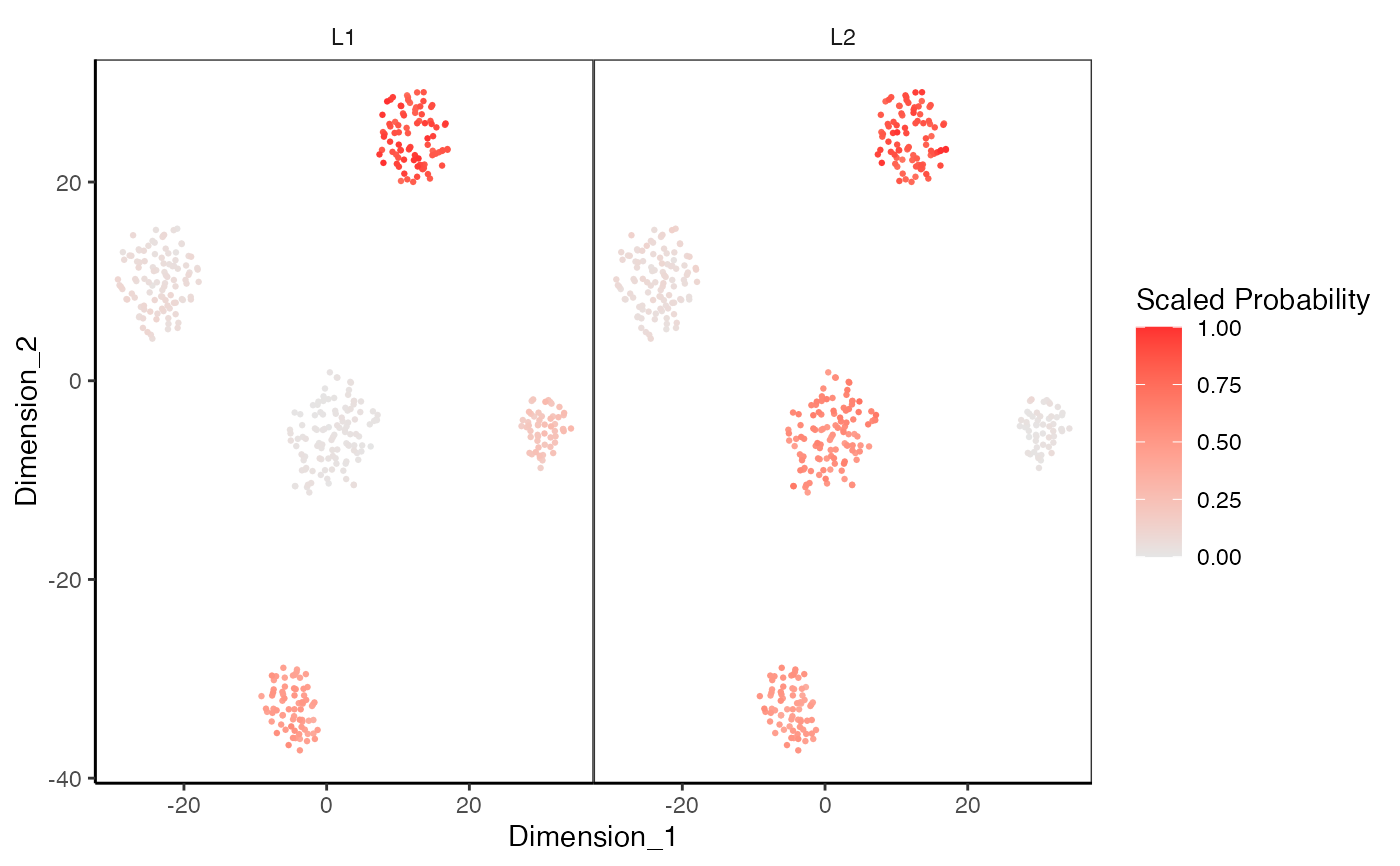
plotDimReduceModule.RdCreate a scatterplot for each row of a normalized gene expression matrix where x and y axis are from a data dimension reduction tool. The cells are colored by the module probability.
plotDimReduceModule(
  x,
  reducedDimName,
  useAssay = "counts",
  altExpName = "featureSubset",
  celdaMod,
  modules = NULL,
  dim1 = NULL,
  dim2 = NULL,
  size = 0.5,
  xlab = NULL,
  ylab = NULL,
  rescale = TRUE,
  limits = c(0, 1),
  colorLow = "grey90",
  colorHigh = "firebrick1",
  ncol = NULL,
  decreasing = FALSE
)

# S4 method for SingleCellExperiment
plotDimReduceModule(
  x,
  reducedDimName,
  useAssay = "counts",
  altExpName = "featureSubset",
  modules = NULL,
  dim1 = 1,
  dim2 = 2,
  size = 0.5,
  xlab = NULL,
  ylab = NULL,
  rescale = TRUE,
  limits = c(0, 1),
  colorLow = "grey90",
  colorHigh = "firebrick1",
  ncol = NULL,
  decreasing = FALSE
)

# S4 method for ANY
plotDimReduceModule(
  x,
  celdaMod,
  modules = NULL,
  dim1,
  dim2,
  size = 0.5,
  xlab = "Dimension_1",
  ylab = "Dimension_2",
  rescale = TRUE,
  limits = c(0, 1),
  colorLow = "grey90",
  colorHigh = "firebrick1",
  ncol = NULL,
  decreasing = FALSE
)
Arguments
- x
Numeric matrix or a SingleCellExperiment object with the matrix located in the assay slot under
useAssay. Rows represent features and columns represent cells.- reducedDimName
The name of the dimension reduction slot in
reducedDimNames(x)ifxis a SingleCellExperiment object. Ignored if bothdim1anddim2are set.- useAssay
A string specifying which assay slot to use if
xis a SingleCellExperiment object. Default "counts".- altExpName
The name for the altExp slot to use. Default "featureSubset".
- celdaMod
Celda object of class "celda_G" or "celda_CG". Used only if
xis a matrix object.- modules
Character vector. Module(s) from celda model to be plotted. e.g. c("1", "2").
- dim1
Integer or numeric vector. If
reducedDimNameis supplied, then, this will be used as an index to determine which dimension will be plotted on the x-axis. IfreducedDimNameis not supplied, then this should be a vector which will be plotted on the x-axis. Default1.- dim2
Integer or numeric vector. If
reducedDimNameis supplied, then, this will be used as an index to determine which dimension will be plotted on the y-axis. IfreducedDimNameis not supplied, then this should be a vector which will be plotted on the y-axis. Default2.- size
Numeric. Sets size of point on plot. Default 0.5.
- xlab
Character vector. Label for the x-axis. Default "Dimension_1".
- ylab
Character vector. Label for the y-axis. Default "Dimension_2".
- rescale
Logical. Whether rows of the matrix should be rescaled to [0, 1]. Default TRUE.
- limits
Passed to scale_colour_gradient. The range of color scale.
- colorLow
Character. A color available from `colors()`. The color will be used to signify the lowest values on the scale.
- colorHigh
Character. A color available from `colors()`. The color will be used to signify the highest values on the scale.
- ncol
Integer. Passed to facet_wrap. Specify the number of columns for facet wrap.
- decreasing
logical. Specifies the order of plotting the points. If
FALSE, the points will be plotted in increasing order where the points with largest values will be on top.TRUEotherwise. IfNULL, no sorting is performed. Points will be plotted in their current order inx. DefaultFALSE.
Value
The plot as a ggplot object
Examples
data(sceCeldaCG)
sce <- celdaTsne(sceCeldaCG)
plotDimReduceModule(x = sce,
  reducedDimName = "celda_tSNE",
  modules = c("1", "2"))

library(SingleCellExperiment)
data(sceCeldaCG, celdaCGMod)
sce <- celdaTsne(sceCeldaCG)
plotDimReduceModule(x = counts(sce),
  dim1 = reducedDim(altExp(sce), "celda_tSNE")[, 1],
  dim2 = reducedDim(altExp(sce), "celda_tSNE")[, 2],
  celdaMod = celdaCGMod,
  modules = c("1", "2"))
library(SingleCellExperiment)
data(sceCeldaCG, celdaCGMod)
sce <- celdaTsne(sceCeldaCG)
plotDimReduceModule(x = counts(sce),
dim1 = reducedDim(altExp(sce), "celda_tSNE")[, 1],
dim2 = reducedDim(altExp(sce), "celda_tSNE")[, 2],
celdaMod = celdaCGMod,
modules = c("1", "2"))