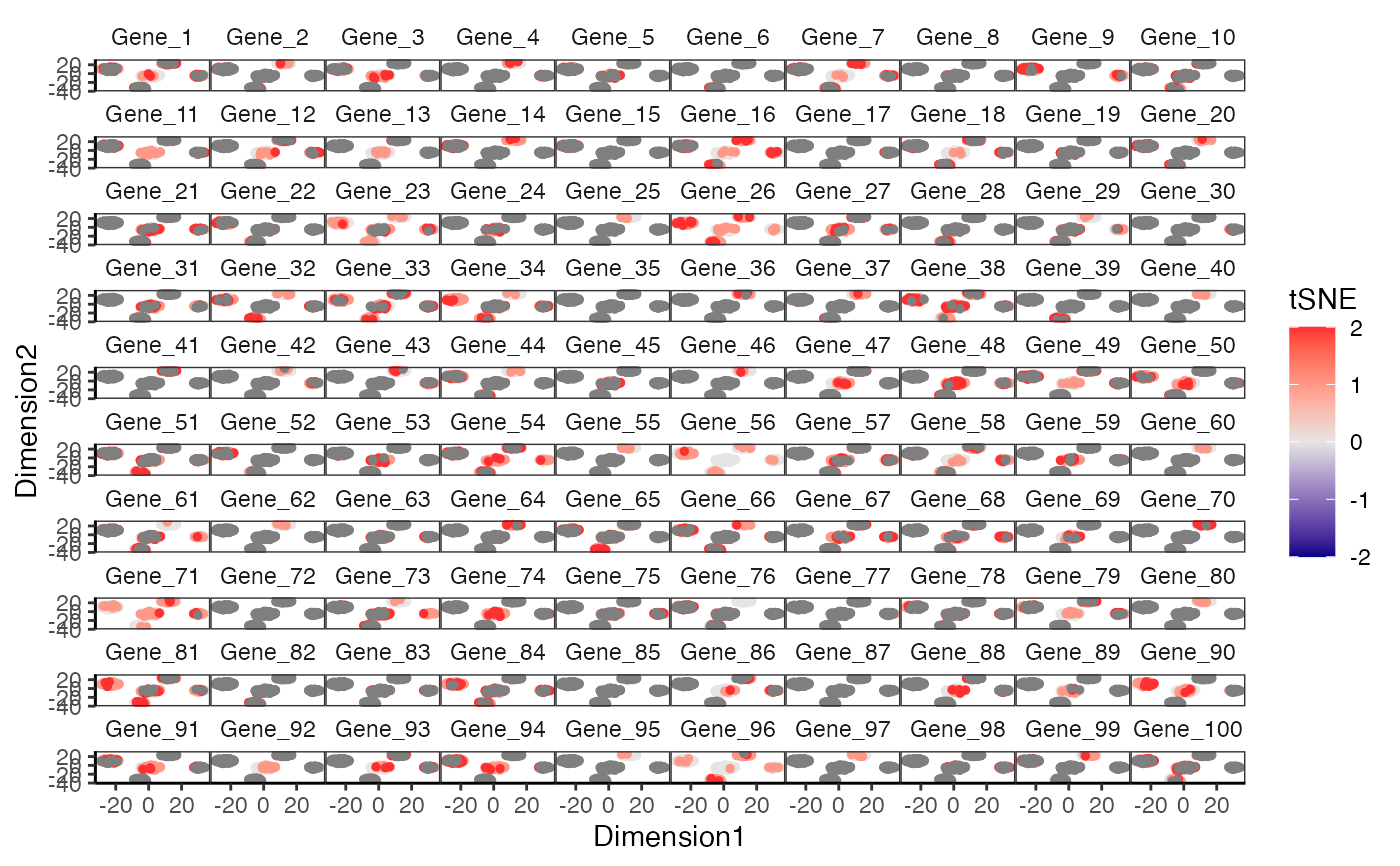
Creates a scatterplot given two dimensions from a data dimension reduction tool (e.g tSNE) output.
plotDimReduceGrid(
  x,
  reducedDimName,
  dim1 = NULL,
  dim2 = NULL,
  useAssay = "counts",
  altExpName = "featureSubset",
  size = 1,
  xlab = "Dimension_1",
  ylab = "Dimension_2",
  limits = c(-2, 2),
  colorLow = "blue4",
  colorMid = "grey90",
  colorHigh = "firebrick1",
  midpoint = 0,
  varLabel = NULL,
  ncol = NULL,
  headers = NULL,
  decreasing = FALSE
)

# S4 method for SingleCellExperiment
plotDimReduceGrid(
  x,
  reducedDimName,
  dim1 = NULL,
  dim2 = NULL,
  useAssay = "counts",
  altExpName = "featureSubset",
  size = 1,
  xlab = "Dimension_1",
  ylab = "Dimension_2",
  limits = c(-2, 2),
  colorLow = "blue4",
  colorMid = "grey90",
  colorHigh = "firebrick1",
  midpoint = 0,
  varLabel = NULL,
  ncol = NULL,
  headers = NULL,
  decreasing = FALSE
)

# S4 method for ANY
plotDimReduceGrid(
  x,
  dim1,
  dim2,
  size = 1,
  xlab = "Dimension_1",
  ylab = "Dimension_2",
  limits = c(-2, 2),
  colorLow = "blue4",
  colorMid = "grey90",
  colorHigh = "firebrick1",
  midpoint = 0,
  varLabel = NULL,
  ncol = NULL,
  headers = NULL,
  decreasing = FALSE
)
Arguments
- x
Numeric matrix or a SingleCellExperiment object with the matrix located in the assay slot under
useAssay. Each row of the matrix will be plotted as a separate facet.- reducedDimName
The name of the dimension reduction slot in
reducedDimNames(x)ifxis a SingleCellExperiment object. Ignored if bothdim1anddim2are set.- dim1
Numeric vector. Second dimension from data dimension reduction output.
- dim2
Numeric vector. Second dimension from data dimension reduction output.
- useAssay
A string specifying which assay slot to use if
xis a SingleCellExperiment object. Default "counts".- altExpName
The name for the altExp slot to use. Default "featureSubset".
- size
Numeric. Sets size of point on plot. Default 1.
- xlab
Character vector. Label for the x-axis. Default 'Dimension_1'.
- ylab
Character vector. Label for the y-axis. Default 'Dimension_2'.
- limits
Passed to scale_colour_gradient2. The range of color scale.
- colorLow
Character. A color available from `colors()`. The color will be used to signify the lowest values on the scale. Default "blue4".
- colorMid
Character. A color available from `colors()`. The color will be used to signify the midpoint on the scale. Default "grey90".
- colorHigh
Character. A color available from `colors()`. The color will be used to signify the highest values on the scale. Default "firebrick1".
- midpoint
Numeric. The value indicating the midpoint of the diverging color scheme. If
NULL, defaults to the mean with 10 percent of values trimmed. Default0.- varLabel
Character vector. Title for the color legend.
- ncol
Integer. Passed to facet_wrap. Specify the number of columns for facet wrap.
- headers
Character vector. If `NULL`, the corresponding rownames are used as labels. Otherwise, these headers are used to label the genes.
- decreasing
logical. Specifies the order of plotting the points. If
FALSE, the points will be plotted in increasing order where the points with largest values will be on top.TRUEotherwise. IfNULL, no sorting is performed. Points will be plotted in their current order inx. DefaultFALSE.
Value
The plot as a ggplot object
Examples
data(sceCeldaCG)
sce <- celdaTsne(sceCeldaCG)
plotDimReduceGrid(x = sce,
  reducedDimName = "celda_tSNE",
  xlab = "Dimension1",
  ylab = "Dimension2",
  varLabel = "tSNE")

library(SingleCellExperiment)
data(sceCeldaCG)
sce <- celdaTsne(sceCeldaCG)
plotDimReduceGrid(x = counts(sce),
  dim1 = reducedDim(altExp(sce), "celda_tSNE")[, 1],
  dim2 = reducedDim(altExp(sce), "celda_tSNE")[, 2],
  xlab = "Dimension1",
  ylab = "Dimension2",
  varLabel = "tSNE")
library(SingleCellExperiment)
data(sceCeldaCG)
sce <- celdaTsne(sceCeldaCG)
plotDimReduceGrid(x = counts(sce),
dim1 = reducedDim(altExp(sce), "celda_tSNE")[, 1],
dim2 = reducedDim(altExp(sce), "celda_tSNE")[, 2],
xlab = "Dimension1",
ylab = "Dimension2",
varLabel = "tSNE")