Plotting feature expression on a dimension reduction plot
Source:R/plot_dr.R
plotDimReduceFeature.RdCreate a scatterplot for each row of a normalized gene expression matrix where x and y axis are from a data dimension reduction tool. The cells are colored by expression of the specified feature.
plotDimReduceFeature(
  x,
  features,
  reducedDimName = NULL,
  displayName = NULL,
  dim1 = NULL,
  dim2 = NULL,
  headers = NULL,
  useAssay = "counts",
  altExpName = "featureSubset",
  normalize = FALSE,
  zscore = TRUE,
  exactMatch = TRUE,
  trim = c(-2, 2),
  limits = c(-2, 2),
  size = 0.5,
  xlab = NULL,
  ylab = NULL,
  colorLow = "blue4",
  colorMid = "grey90",
  colorHigh = "firebrick1",
  midpoint = 0,
  ncol = NULL,
  decreasing = FALSE
)

# S4 method for SingleCellExperiment
plotDimReduceFeature(
  x,
  features,
  reducedDimName = NULL,
  displayName = NULL,
  dim1 = 1,
  dim2 = 2,
  headers = NULL,
  useAssay = "counts",
  altExpName = "featureSubset",
  normalize = FALSE,
  zscore = TRUE,
  exactMatch = TRUE,
  trim = c(-2, 2),
  limits = c(-2, 2),
  size = 0.5,
  xlab = NULL,
  ylab = NULL,
  colorLow = "blue4",
  colorMid = "grey90",
  colorHigh = "firebrick1",
  midpoint = 0,
  ncol = NULL,
  decreasing = FALSE
)

# S4 method for ANY
plotDimReduceFeature(
  x,
  features,
  dim1,
  dim2,
  headers = NULL,
  normalize = FALSE,
  zscore = TRUE,
  exactMatch = TRUE,
  trim = c(-2, 2),
  limits = c(-2, 2),
  size = 0.5,
  xlab = "Dimension_1",
  ylab = "Dimension_2",
  colorLow = "blue4",
  colorMid = "grey90",
  colorHigh = "firebrick1",
  midpoint = 0,
  ncol = NULL,
  decreasing = FALSE
)
Arguments
- x
Numeric matrix or a SingleCellExperiment object with the matrix located in the assay slot under
useAssay. Rows represent features and columns represent cells.- features
Character vector. Features in the rownames of counts to plot.
- reducedDimName
The name of the dimension reduction slot in
reducedDimNames(x)ifxis a SingleCellExperiment object. IfNULL, then bothdim1anddim2need to be set. DefaultNULL.- displayName
Character. The column name of
rowData(x)that specifies the display names for the features. DefaultNULL, which displays the row names. Only works ifxis a SingleCellExperiment object. Overwritesheaders.- dim1
Integer or numeric vector. If
reducedDimNameis supplied, then, this will be used as an index to determine which dimension will be plotted on the x-axis. IfreducedDimNameis not supplied, then this should be a vector which will be plotted on the x-axis. Default1.- dim2
Integer or numeric vector. If
reducedDimNameis supplied, then, this will be used as an index to determine which dimension will be plotted on the y-axis. IfreducedDimNameis not supplied, then this should be a vector which will be plotted on the y-axis. Default2.- headers
Character vector. If
NULL, the corresponding rownames are used as labels. Otherwise, these headers are used to label the features. Only works ifdisplayNameisNULLandexactMatchisFALSE.- useAssay
A string specifying which assay slot to use if
xis a SingleCellExperiment object. Default "counts".- altExpName
The name for the altExp slot to use. Default "featureSubset".
- normalize
Logical. Whether to normalize the columns of `counts`. Default
FALSE.- zscore
Logical. Whether to scale each feature to have a mean 0 and standard deviation of 1. Default
TRUE.- exactMatch
Logical. Whether an exact match or a partial match using
grep()is used to look up the feature in the rownames of the counts matrix. Default TRUE.- trim
Numeric vector. Vector of length two that specifies the lower and upper bounds for the data. This threshold is applied after row scaling. Set to NULL to disable. Default
c(-1,1).- limits
Passed to scale_colour_gradient2. The range of color scale.
- size
Numeric. Sets size of point on plot. Default 1.
- xlab
Character vector. Label for the x-axis. If
reducedDimNameis used, then this will be set to the column name of the first dimension of that object. Default "Dimension_1".- ylab
Character vector. Label for the y-axis. If
reducedDimNameis used, then this will be set to the column name of the second dimension of that object. Default "Dimension_2".- colorLow
Character. A color available from `colors()`. The color will be used to signify the lowest values on the scale.
- colorMid
Character. A color available from `colors()`. The color will be used to signify the midpoint on the scale.
- colorHigh
Character. A color available from `colors()`. The color will be used to signify the highest values on the scale.
- midpoint
Numeric. The value indicating the midpoint of the diverging color scheme. If
NULL, defaults to the mean with 10 percent of values trimmed. Default0.- ncol
Integer. Passed to facet_wrap. Specify the number of columns for facet wrap.
- decreasing
logical. Specifies the order of plotting the points. If
FALSE, the points will be plotted in increasing order where the points with largest values will be on top.TRUEotherwise. IfNULL, no sorting is performed. Points will be plotted in their current order inx. DefaultFALSE.
Value
The plot as a ggplot object
Examples
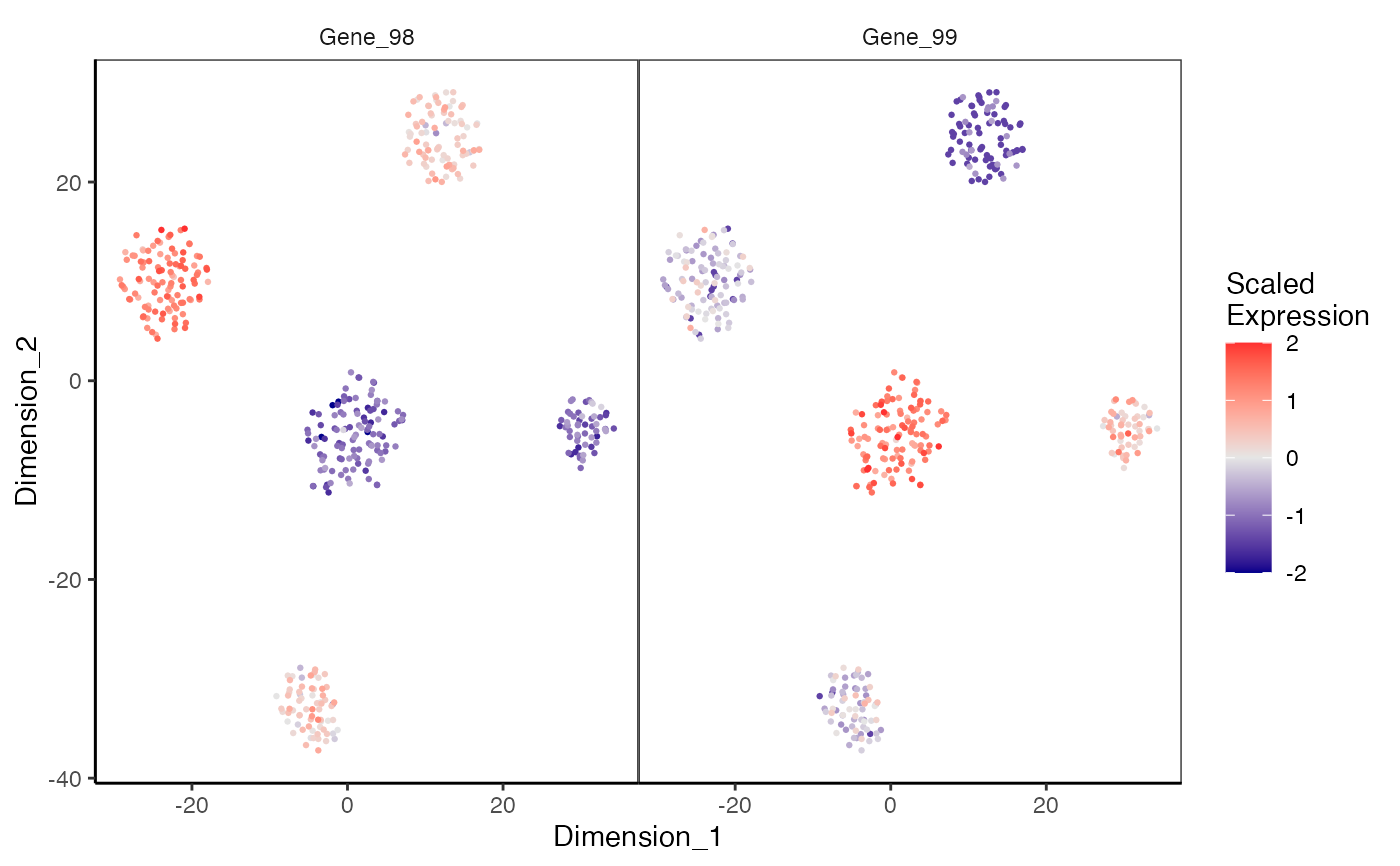
data(sceCeldaCG)
sce <- celdaTsne(sceCeldaCG)
plotDimReduceFeature(x = sce,
reducedDimName = "celda_tSNE",
normalize = TRUE,
features = c("Gene_98", "Gene_99"),
exactMatch = TRUE)
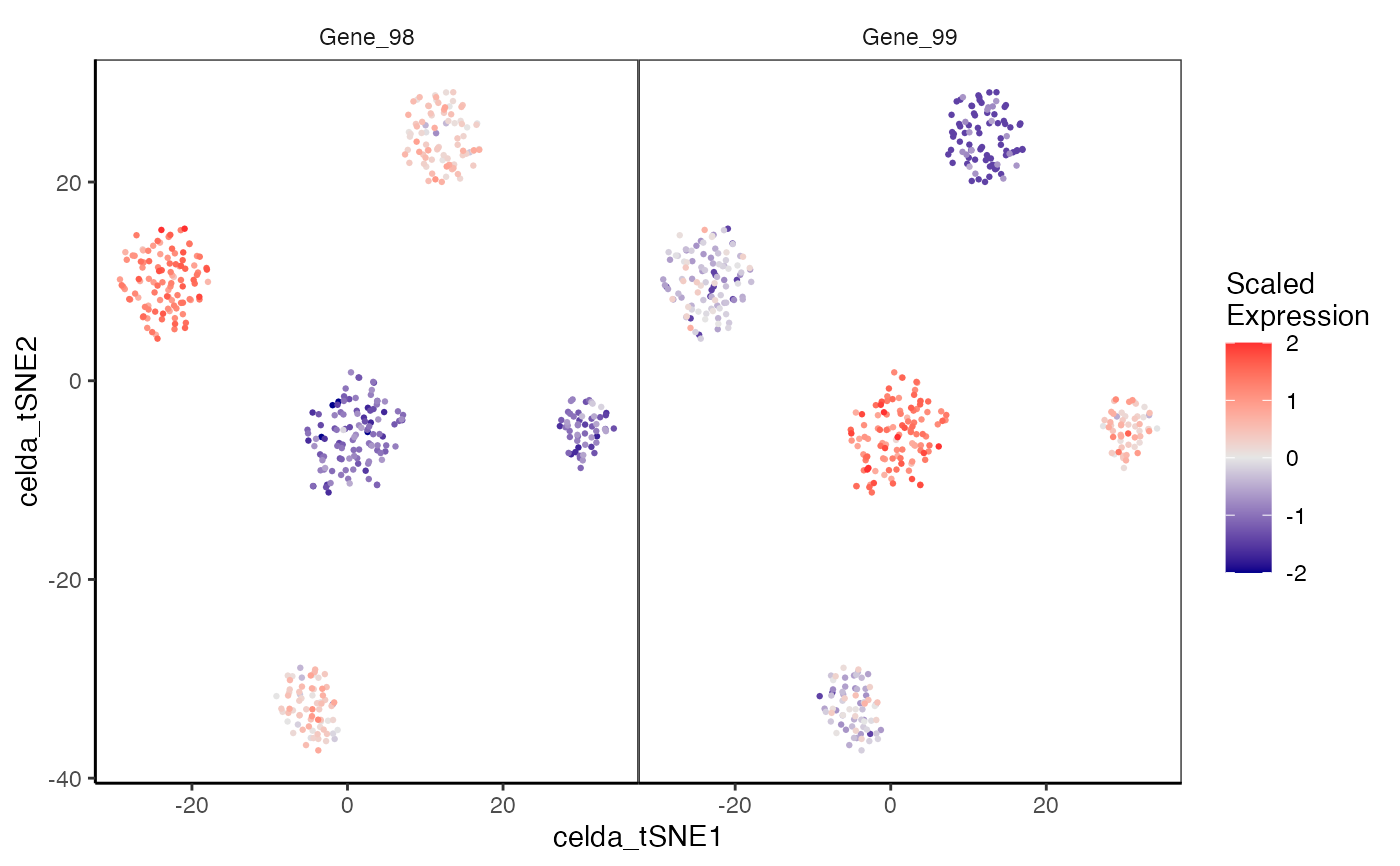 library(SingleCellExperiment)
data(sceCeldaCG)
sce <- celdaTsne(sceCeldaCG)
plotDimReduceFeature(x = counts(sce),
dim1 = reducedDim(altExp(sce), "celda_tSNE")[, 1],
dim2 = reducedDim(altExp(sce), "celda_tSNE")[, 2],
normalize = TRUE,
features = c("Gene_98", "Gene_99"),
exactMatch = TRUE)
library(SingleCellExperiment)
data(sceCeldaCG)
sce <- celdaTsne(sceCeldaCG)
plotDimReduceFeature(x = counts(sce),
dim1 = reducedDim(altExp(sce), "celda_tSNE")[, 1],
dim2 = reducedDim(altExp(sce), "celda_tSNE")[, 2],
normalize = TRUE,
features = c("Gene_98", "Gene_99"),
exactMatch = TRUE)