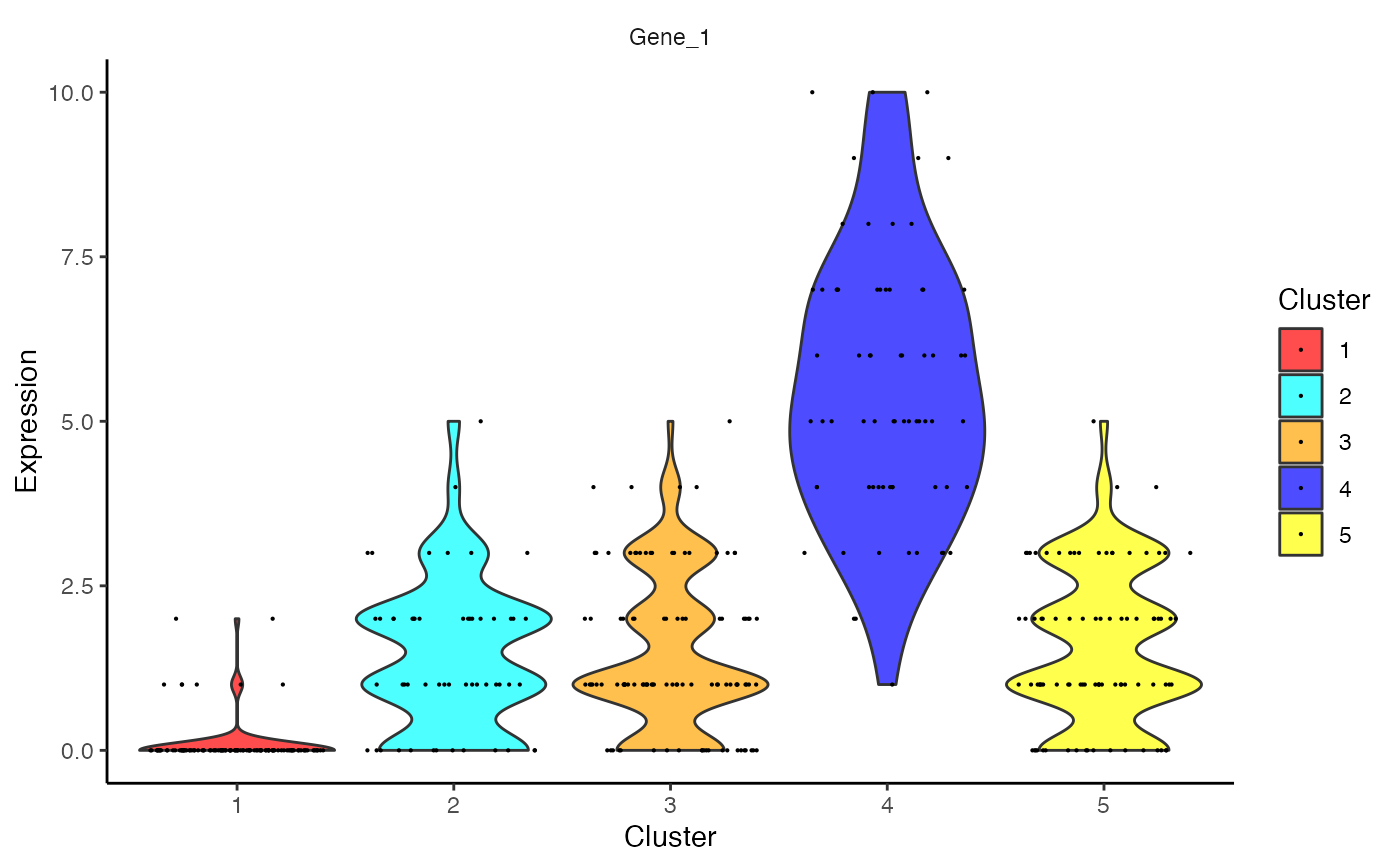
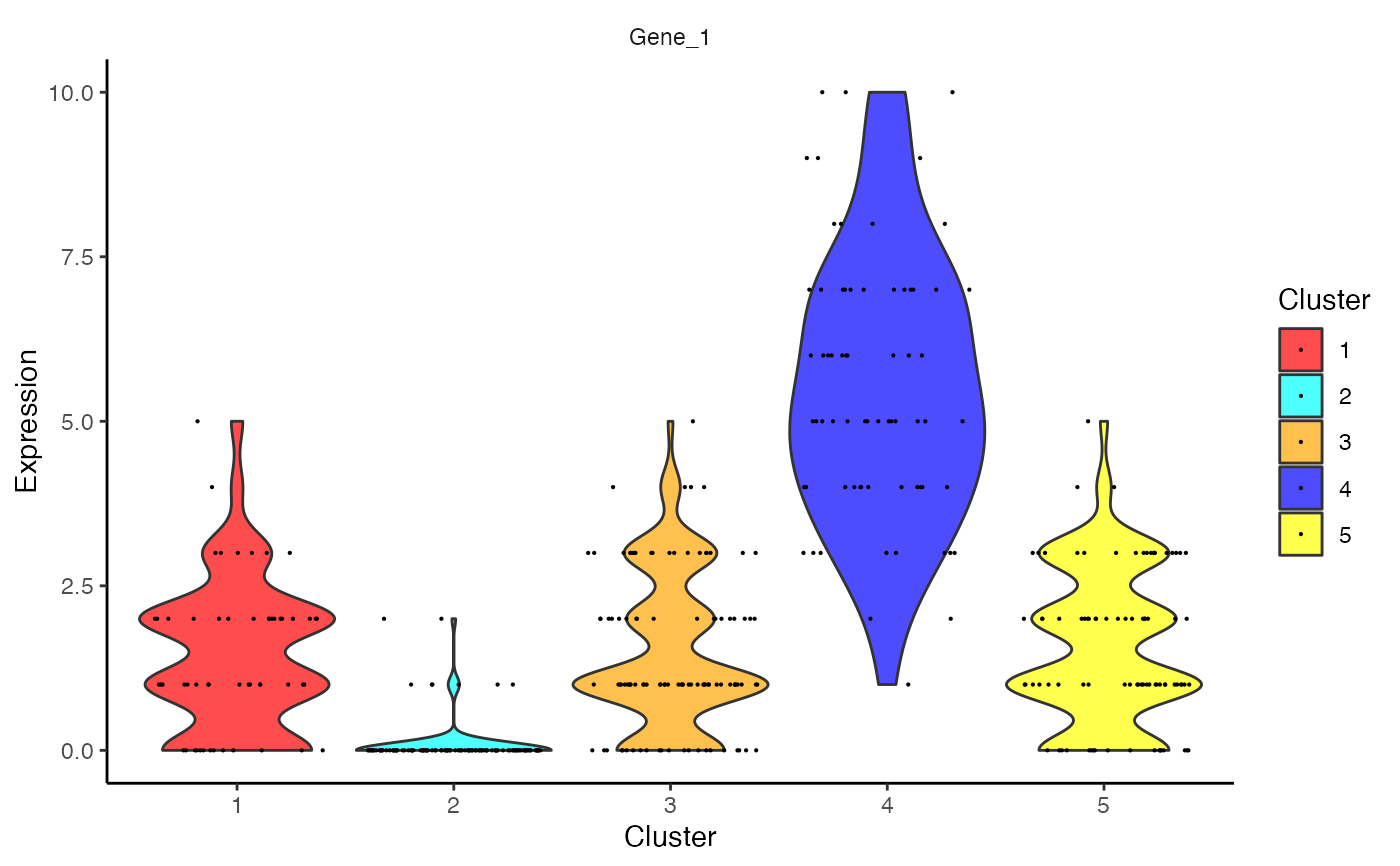
Outputs a violin plot for feature expression data.
plotCeldaViolin(
  x,
  celdaMod,
  features,
  displayName = NULL,
  useAssay = "counts",
  altExpName = "featureSubset",
  exactMatch = TRUE,
  plotDots = TRUE,
  dotSize = 0.1
)

# S4 method for SingleCellExperiment
plotCeldaViolin(
  x,
  features,
  displayName = NULL,
  useAssay = "counts",
  altExpName = "featureSubset",
  exactMatch = TRUE,
  plotDots = TRUE,
  dotSize = 0.1
)

# S4 method for ANY
plotCeldaViolin(
  x,
  celdaMod,
  features,
  exactMatch = TRUE,
  plotDots = TRUE,
  dotSize = 0.1
)
Arguments
- x
Numeric matrix or a SingleCellExperiment object with the matrix located in the assay slot under
useAssay. Rows represent features and columns represent cells.- celdaMod
Celda object of class "celda_G" or "celda_CG". Used only if
xis a matrix object.- features
Character vector. Uses these genes for plotting.
- displayName
Character. The column name of
rowData(x)that specifies the display names for the features. DefaultNULL, which displays the row names. Only works ifxis a SingleCellExperiment object.- useAssay
A string specifying which assay slot to use if
xis a SingleCellExperiment object. Default "counts".- altExpName
The name for the altExp slot to use. Default "featureSubset".
- exactMatch
Logical. Whether an exact match or a partial match using
grep()is used to look up the feature in the rownames of the counts matrix. DefaultTRUE.- plotDots
Boolean. If
TRUE, the expression of features will be plotted as points in addition to the violin curve. DefaultTRUE.- dotSize
Numeric. Size of points if
plotDots = TRUE. Default0.1.
Value
Violin plot for each feature, grouped by celda cluster