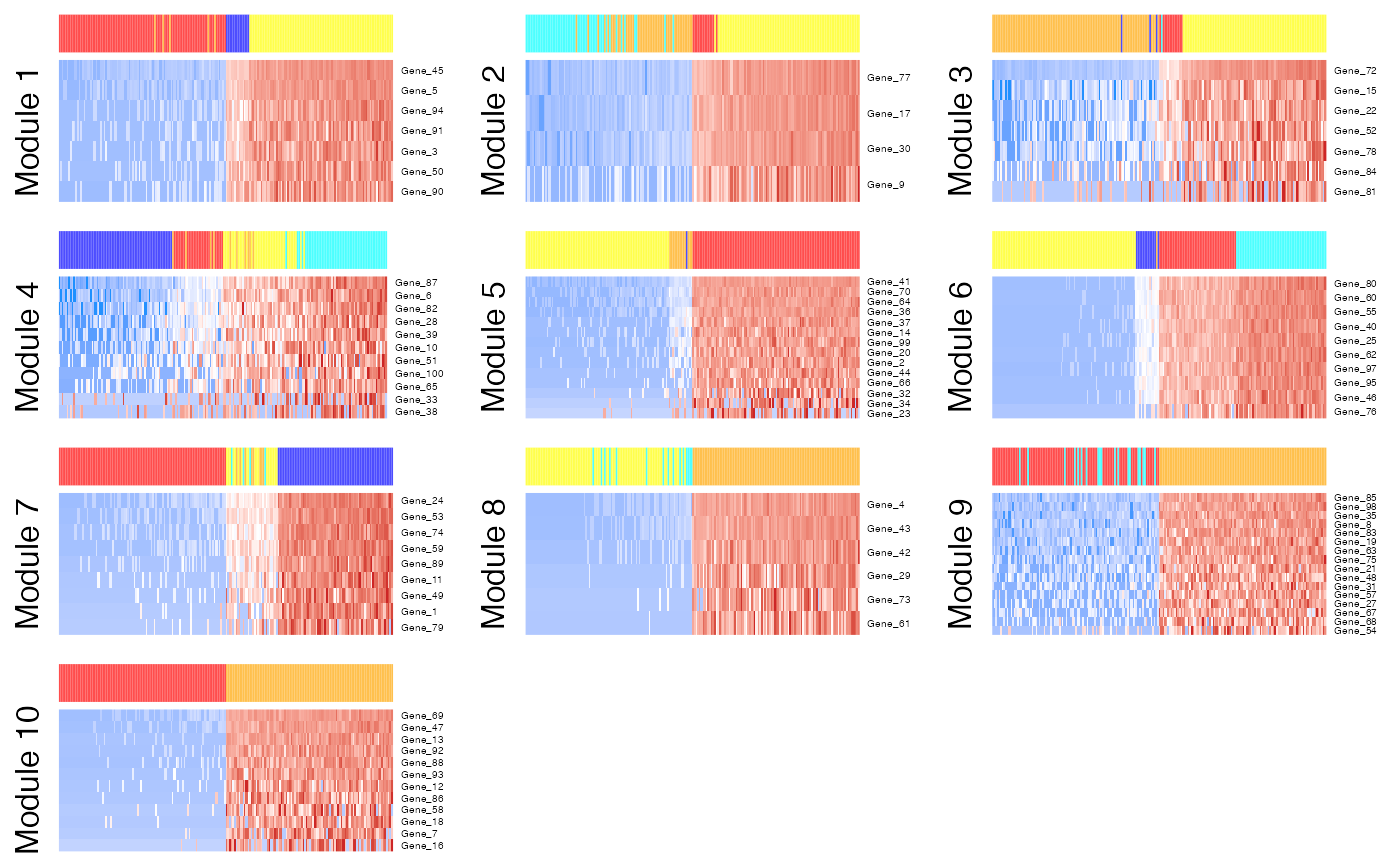
Renders a heatmap for selected featureModule. Cells are
ordered from those with the lowest probability of the module on the left to
the highest probability on the right. Features are ordered from those
with the highest probability in the module
on the top to the lowest probability on the bottom.
moduleHeatmap(
  x,
  useAssay = "counts",
  altExpName = "featureSubset",
  modules = NULL,
  featureModule = NULL,
  col = circlize::colorRamp2(c(-2, 0, 2), c("#1E90FF", "#FFFFFF", "#CD2626")),
  topCells = 100,
  topFeatures = NULL,
  normalizedCounts = NA,
  normalize = "proportion",
  transformationFun = sqrt,
  scaleRow = scale,
  showFeatureNames = TRUE,
  displayName = NULL,
  trim = c(-2, 2),
  rowFontSize = NULL,
  showHeatmapLegend = FALSE,
  showTopAnnotationLegend = FALSE,
  showTopAnnotationName = FALSE,
  topAnnotationHeight = 5,
  showModuleLabel = TRUE,
  moduleLabel = "auto",
  moduleLabelSize = NULL,
  byrow = TRUE,
  top = NA,
  unit = "mm",
  ncol = NULL,
  useRaster = TRUE,
  returnAsList = FALSE,
  ...
)

# S4 method for SingleCellExperiment
moduleHeatmap(
  x,
  useAssay = "counts",
  altExpName = "featureSubset",
  modules = NULL,
  featureModule = NULL,
  col = circlize::colorRamp2(c(-2, 0, 2), c("#1E90FF", "#FFFFFF", "#CD2626")),
  topCells = 100,
  topFeatures = NULL,
  normalizedCounts = NA,
  normalize = "proportion",
  transformationFun = sqrt,
  scaleRow = scale,
  showFeatureNames = TRUE,
  displayName = NULL,
  trim = c(-2, 2),
  rowFontSize = NULL,
  showHeatmapLegend = FALSE,
  showTopAnnotationLegend = FALSE,
  showTopAnnotationName = FALSE,
  topAnnotationHeight = 5,
  showModuleLabel = TRUE,
  moduleLabel = "auto",
  moduleLabelSize = NULL,
  byrow = TRUE,
  top = NA,
  unit = "mm",
  ncol = NULL,
  useRaster = TRUE,
  returnAsList = FALSE,
  ...
)
Arguments
- x
A numeric matrix of counts or a SingleCellExperiment with the matrix located in the assay slot under
useAssay. Rows represent features and columns represent cells. Celda results must be present undermetadata(altExp(x, altExpName)).- useAssay
A string specifying which assay slot to use if
xis a SingleCellExperiment object. Default "counts".- altExpName
The name for the altExp slot to use. Default "featureSubset".
- modules
Integer Vector. The featureModule(s) to display. Multiple modules can be included in a vector. Default
NULLwhich plots all module heatmaps.- featureModule
Same as
modules. Either can be used to specify the modules to display.- col
Passed to Heatmap. Set color boundaries and colors.
- topCells
Integer. Number of cells with the highest and lowest probabilities for each module to include in the heatmap. For example, if
topCells = 50, the 50 cells with the lowest probabilities and the 50 cells with the highest probabilities for each featureModule will be included. If NULL, all cells will be plotted. Default 100.- topFeatures
Integer. Plot `topFeatures` features with the highest probabilities in the module heatmap for each featureModule. If
NULL, plot all features in the module. DefaultNULL.- normalizedCounts
Integer matrix. Rows represent features and columns represent cells. If you have a normalized matrix result from normalizeCounts, you can pass through the result here to skip the normalization step in this function. Make sure the colnames and rownames match the object in x. This matrix should correspond to one generated from this count matrix
assay(altExp(x, altExpName), i = useAssay). IfNA, normalization will be carried out in the following formnormalizeCounts(assay(altExp(x, altExpName), i = useAssay), normalize = "proportion", transformationFun = sqrt). Use of this parameter is particularly useful for plotting many module heatmaps, where normalizing the counts matrix repeatedly would be too time consuming. Default NA.- normalize
Character. Passed to normalizeCounts if
normalizedCountsisNA. Divides counts by the library sizes for each cell. One of 'proportion', 'cpm', 'median', or 'mean'. 'proportion' uses the total counts for each cell as the library size. 'cpm' divides the library size of each cell by one million to produce counts per million. 'median' divides the library size of each cell by the median library size across all cells. 'mean' divides the library size of each cell by the mean library size across all cells. Default "proportion".- transformationFun
Function. Passed to normalizeCounts if
normalizedCountsisNA. Applies a transformation such as sqrt, log, log2, log10, or log1p. IfNULL, no transformation will be applied. Occurs after normalization. Default sqrt.- scaleRow
Function. Which function to use to scale each individual row. Set to NULL to disable. Occurs after normalization and log transformation. For example, scale will Z-score transform each row. Default scale.
- showFeatureNames
Logical. Whether feature names should be displayed. Default TRUE.
- displayName
Character. The column name of
rowData(altExp(x, altExpName))that specifies the display names for the features. DefaultNULL, which displays the row names. Only works ifshowFeaturenamesisTRUEandxis a SingleCellExperiment object.- trim
Numeric vector. Vector of length two that specifies the lower and upper bounds for plotting the data. This threshold is applied after row scaling. Set to NULL to disable. Default
c(-2,2).- rowFontSize
Numeric. Font size for feature names. If
NULL, then the size will automatically be determined. DefaultNULL.- showHeatmapLegend
Passed to Heatmap. Show legend for expression levels.
- showTopAnnotationLegend
Passed to HeatmapAnnotation. Show legend for cell annotation.
- showTopAnnotationName
Passed to HeatmapAnnotation. Show heatmap top annotation name.
- topAnnotationHeight
Passed to HeatmapAnnotation. Column annotation height. rowAnnotation. Show legend for module annotation.
- showModuleLabel
Show left side module labels.
- moduleLabel
The left side row titles for module heatmap. Must be vector of the same length as
featureModule. Default "auto", which automatically pulls module labels fromx.- moduleLabelSize
Passed to gpar. The size of text (in points).
- byrow
Passed to matrix. logical. If
FALSE(the default) the figure panel is filled by columns, otherwise the figure panel is filled by rows.- top
Passed to marrangeGrob. The title for each page.
- unit
Passed to unit. Single character object defining the unit of all dimensions defined.
- ncol
Integer. Number of columns of module heatmaps. If
NULL, then this will be automatically calculated so that the number of columns and rows will be approximately the same. DefaultNULL.- useRaster
Boolean. Rasterizing will make the heatmap a single object and reduced the memory of the plot and the size of a file. If
NULL, then rasterization will be automatically determined by the underlying Heatmap function. DefaultTRUE.- returnAsList
Boolean. If
TRUE, then a list of plots will be returned instead of a single multi-panel figure. These plots can be displayed using the grid.draw function. DefaultFALSE.- ...
Additional parameters passed to Heatmap.
Value
A list object if plotting more than one module heatmaps. Otherwise a
HeatmapList object is returned.
Examples
data(sceCeldaCG)
moduleHeatmap(sceCeldaCG, displayName = "rownames")