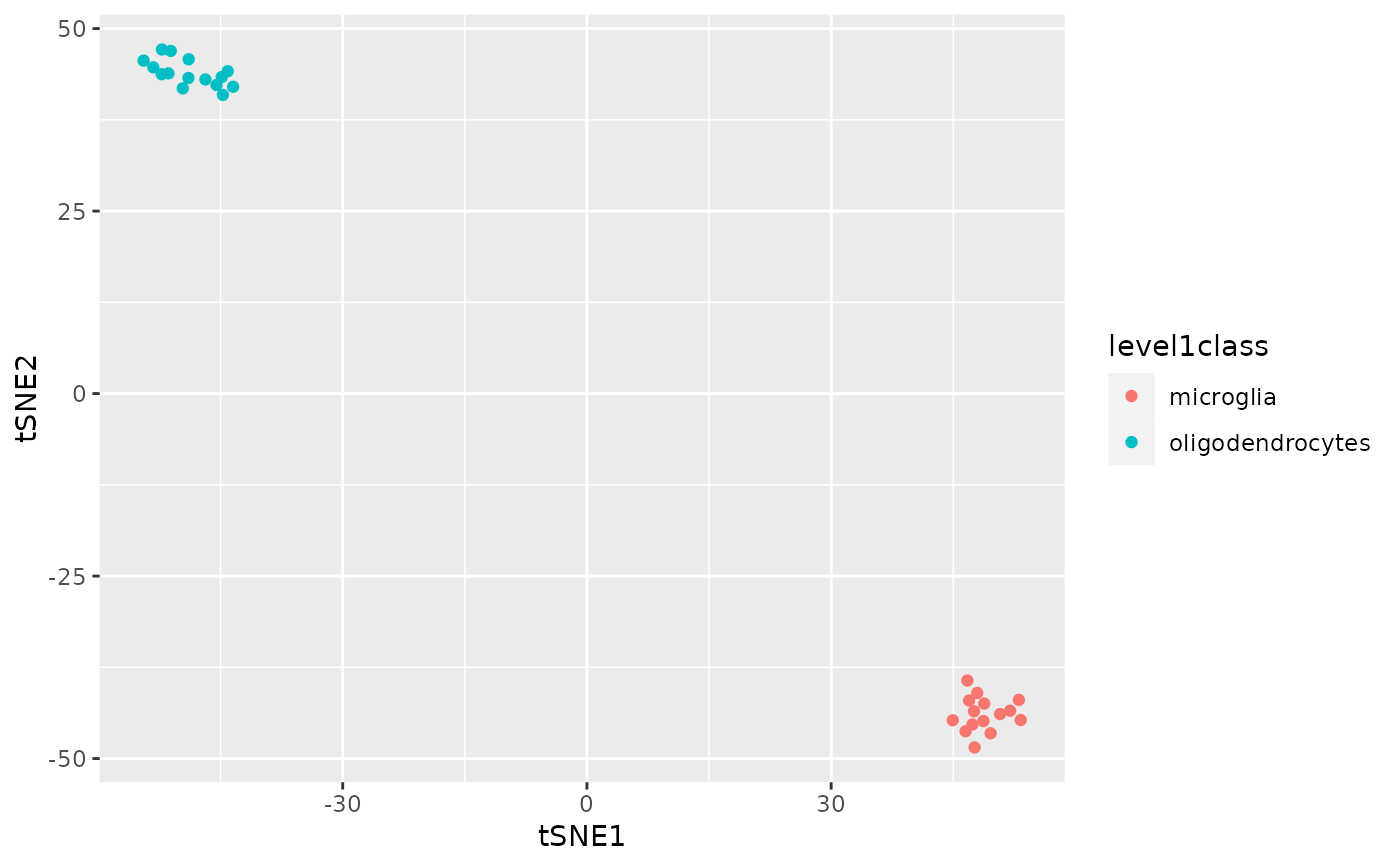
Plot t-SNE plot on dimensionality reduction data run from t-SNE method.
Source:R/plotTSNE.R
plotTSNE.RdPlot t-SNE plot on dimensionality reduction data run from t-SNE method.
plotTSNE(
  inSCE,
  colorBy = NULL,
  shape = NULL,
  reducedDimName = "TSNE",
  runTSNE = FALSE,
  useAssay = "counts"
)
Arguments
- inSCE
Input SingleCellExperiment object.
- colorBy
color by condition.
- shape
add shape to each distinct label.
- reducedDimName
a name to store the results of the dimension reduction coordinates obtained from this method. This is stored in the SingleCellExperiment object in the reducedDims slot. Required.
- runTSNE
Run t-SNE if the reducedDimName does not exist. the Default is FALSE.
- useAssay
Indicate which assay to use. The default is "logcounts".
Value
A t-SNE plot
Examples
data("mouseBrainSubsetSCE")
plotTSNE(mouseBrainSubsetSCE, colorBy = "level1class",
         reducedDimName = "TSNE_counts")