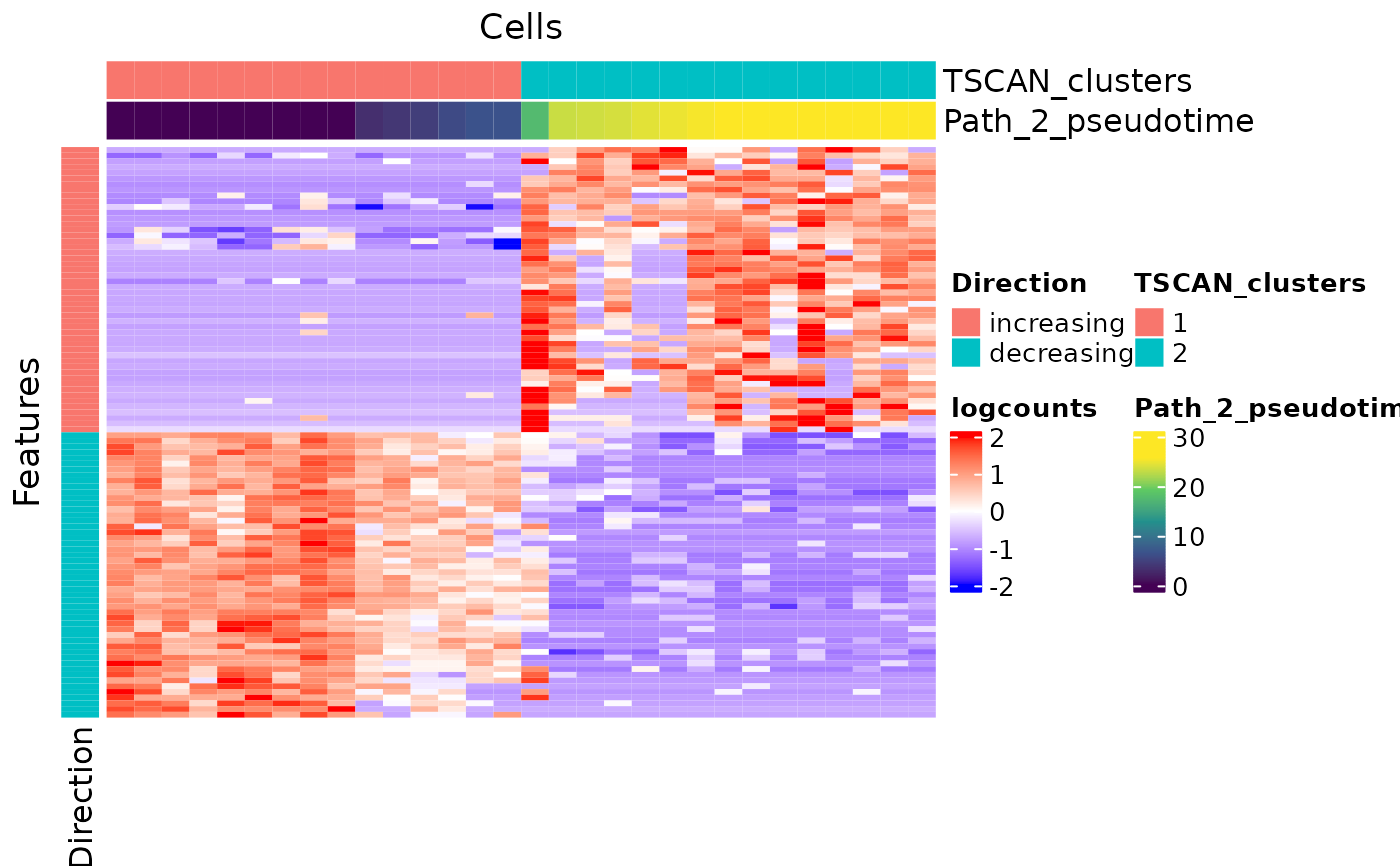
Plot heatmap of genes with expression change along TSCAN pseudotime
Source:R/runTSCAN.R
plotTSCANPseudotimeHeatmap.RdA wrapper function which visualizes outputs from the
runTSCANDEG function. Plots the top genes that change in
expression with increasing pseudotime along the path in the MST.
runTSCANDEG has to be run in advance with using the same
pathIndex of interest.
plotTSCANPseudotimeHeatmap(
  inSCE,
  pathIndex,
  direction = c("both", "increasing", "decreasing"),
  topN = 50,
  log2fcThreshold = NULL,
  useAssay = NULL,
  featureDisplay = metadata(inSCE)$featureDisplay
)
Arguments
- inSCE
Input SingleCellExperiment object.
- pathIndex
Path index for which the pseudotime values should be used. Should have being used in
runTSCANDEG.- direction
Should we show features with expression increasing or decreeasing along the increase in TSCAN pseudotime? Choices are
"both","increasing"or"decreasing".- topN
An integer. Only to plot this number of top genes along the path in the MST, in terms of FDR value. Use
NULLto cancel the top N subscription. Default30.- log2fcThreshold
Only output DEGs with the absolute values of log2FC larger than this value. Default
NULL.- useAssay
A single character to specify a feature expression matrix in
assaysslot. The expression of top features from here will be visualized. DefaultNULLuse the one used forrunTSCANDEG.- featureDisplay
Whether to display feature ID and what ID type to display. Users can set default ID type by
setSCTKDisplayRow.NULLwill display when number of features to display is less than 60.FALSEfor no display. Variable name inrowDatato indicate ID type."rownames"orTRUEfor usingrownames(inSCE).
Value
A ComplexHeatmap in .ggplot class
Examples
data("mouseBrainSubsetSCE", package = "singleCellTK")
mouseBrainSubsetSCE <- runTSCAN(inSCE = mouseBrainSubsetSCE,
                                useReducedDim = "PCA_logcounts")
#> Sat Mar 18 10:30:15 2023 ... Running 'scran SNN clustering' with 'louvain' algorithm
#> Sat Mar 18 10:30:15 2023 ...   Identified 2 clusters
#> Sat Mar 18 10:30:15 2023 ... Running TSCAN to estimate pseudotime
#> Sat Mar 18 10:30:16 2023 ...   Clusters involved in path index 2 are: 1, 2
#> Sat Mar 18 10:30:16 2023 ...   Number of estimated paths is 1
terminalNodes <- listTSCANTerminalNodes(mouseBrainSubsetSCE)
mouseBrainSubsetSCE <- runTSCANDEG(inSCE = mouseBrainSubsetSCE,
                                   pathIndex = terminalNodes[1])
plotTSCANPseudotimeHeatmap(mouseBrainSubsetSCE,
                           pathIndex = terminalNodes[1])