Plot results of reduced dimensions data and colors by feature data stored in the assays slot.
plotSCEDimReduceFeatures(
  inSCE,
  feature,
  reducedDimName,
  sample = NULL,
  featureLocation = NULL,
  featureDisplay = NULL,
  shape = NULL,
  useAssay = "logcounts",
  xlab = NULL,
  ylab = NULL,
  axisSize = 10,
  axisLabelSize = 10,
  dim1 = NULL,
  dim2 = NULL,
  bin = NULL,
  binLabel = NULL,
  dotSize = 0.1,
  transparency = 1,
  colorLow = "white",
  colorMid = "gray",
  colorHigh = "blue",
  defaultTheme = TRUE,
  title = NULL,
  titleSize = 15,
  legendTitle = NULL,
  legendSize = 10,
  legendTitleSize = 12,
  groupBy = NULL,
  combinePlot = "none",
  plotLabels = NULL
)
Arguments
- inSCE
Input SingleCellExperiment object with saved dimension reduction components or a variable with saved results. Required.
- feature
Name of feature stored in assay of SingleCellExperiment object.
- reducedDimName
saved dimension reduction name in the SingleCellExperiment object. Required.
- sample
Character vector. Indicates which sample each cell belongs to.
- featureLocation
Indicates which column name of rowData to query gene.
- featureDisplay
Indicates which column name of rowData to use to display feature for visualization.
- shape
add shapes to each condition. Default NULL.
- useAssay
Indicate which assay to use. The default is "logcounts"
- xlab
Character vector. Label for x-axis. Default NULL.
- ylab
Character vector. Label for y-axis. Default NULL.
- axisSize
Size of x/y-axis ticks. Default 10.
- axisLabelSize
Size of x/y-axis labels. Default 10.
- dim1
1st dimension to be used for plotting. Can either be a string which specifies the name of the dimension to be plotted from reducedDims, or a numeric value which specifies the index of the dimension to be plotted. Default is NULL.
- dim2
2nd dimension to be used for plotting. Can either be a string which specifies the name of the dimension to be plotted from reducedDims, or a numeric value which specifies the index of the dimension to be plotted. Default is NULL.
- bin
Numeric vector. If single value, will divide the numeric values into the `bin` groups. If more than one value, will bin numeric values using values as a cut point.
- binLabel
Character vector. Labels for the bins created by the `bin` parameter. Default NULL.
- dotSize
Size of dots. Default 0.1.
- transparency
Transparency of the dots, values will be 0-1. Default 1.
- colorLow
Character. A color available from `colors()`. The color will be used to signify the lowest values on the scale. Default 'white'.
- colorMid
Character. A color available from `colors()`. The color will be used to signify the midpoint on the scale. Default 'gray'.
- colorHigh
Character. A color available from `colors()`. The color will be used to signify the highest values on the scale. Default 'blue'.
- defaultTheme
adds grid to plot when TRUE. Default TRUE.
- title
Title of plot. Default NULL.
- titleSize
Size of title of plot. Default 15.
- legendTitle
title of legend. Default NULL.
- legendSize
size of legend. Default 10.
- legendTitleSize
size of legend title. Default 12.
- groupBy
Facet wrap the scatterplot based on value. Default
NULL.- combinePlot
Must be either "all", "sample", or "none". "all" will combine all plots into a single .ggplot object, while "sample" will output a list of plots separated by sample. Default "none".
- plotLabels
labels to each plot. If set to "default", will use the name of the samples as the labels. If set to "none", no label will be plotted.
Value
a ggplot of the reduced dimension plot of feature data.
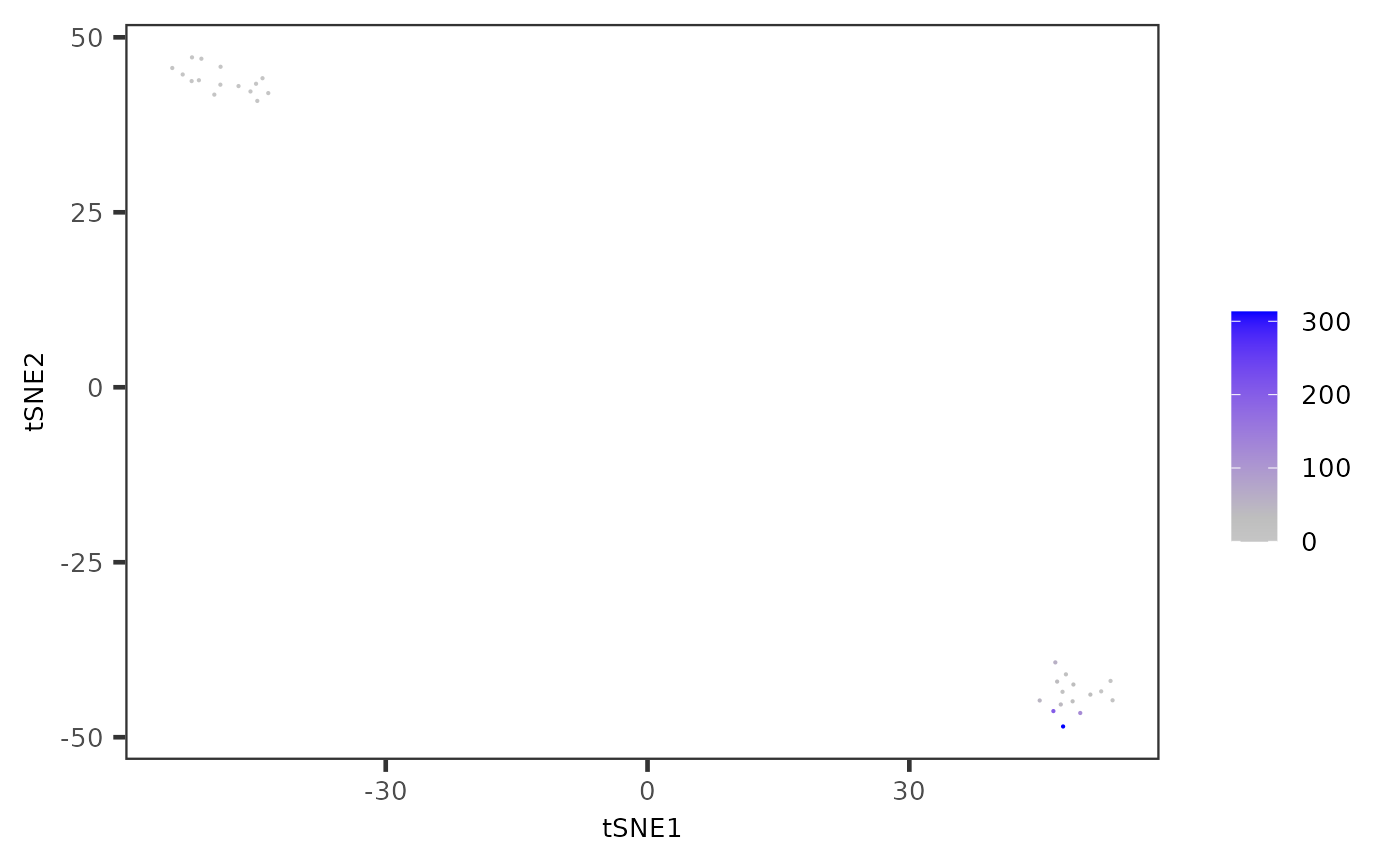
Examples
data("mouseBrainSubsetSCE")
plotSCEDimReduceFeatures(
  inSCE = mouseBrainSubsetSCE, feature = "Apoe",
  shape = NULL, reducedDimName = "TSNE_counts",
  useAssay = "counts", xlab = "tSNE1", ylab = "tSNE2"
)