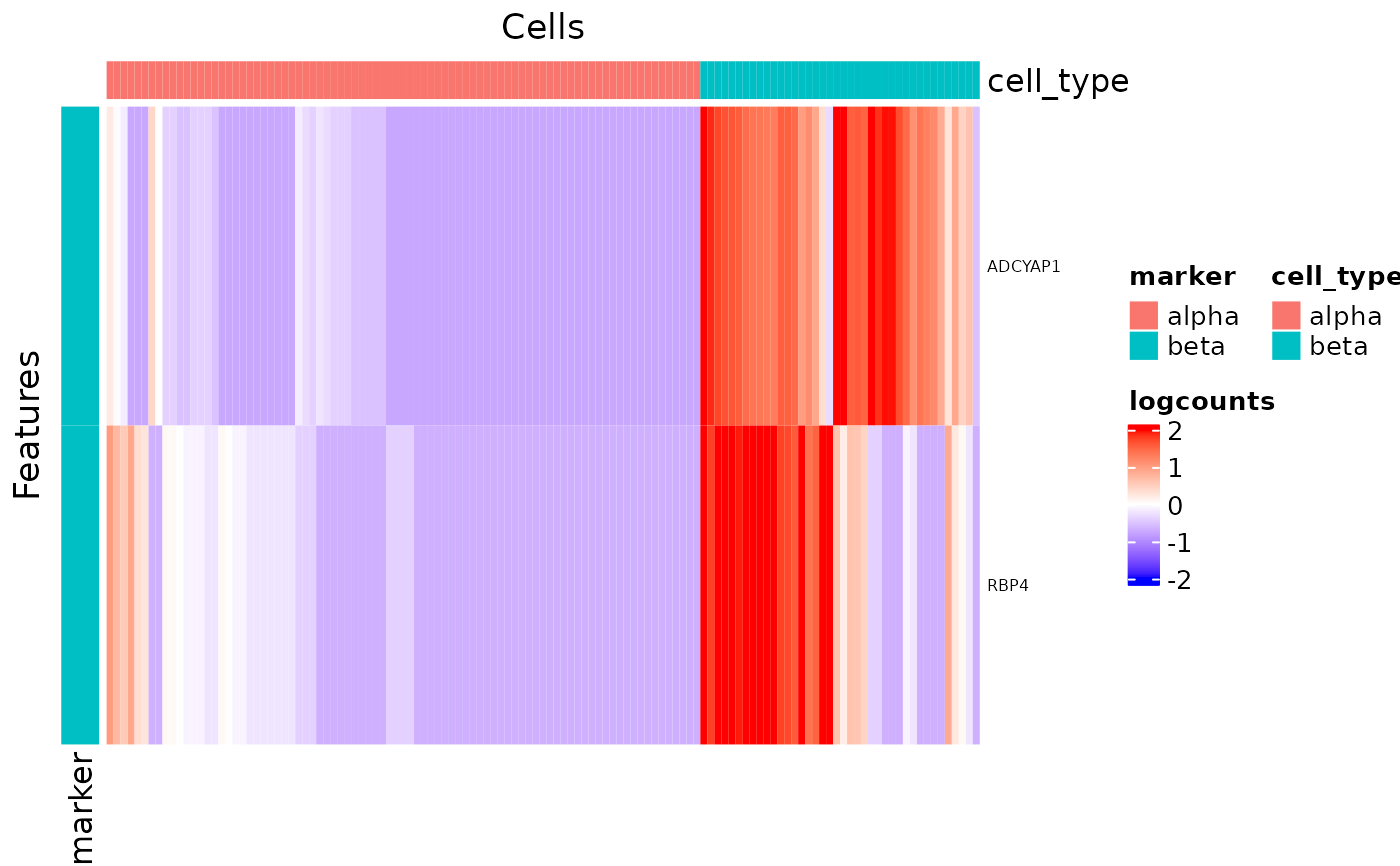
Plot a heatmap to visualize the result of runFindMarker
Source: R/plotFindMarkerHeatmap.R
plotFindMarkerHeatmap.RdThis function will first reads the result saved in
metadata slot, named by "findMarker" and generated by
runFindMarker. Then it do the filtering on the statistics
based on the input parameters and get unique genes to plot. We choose the
genes that are identified as up-regulated only. As for the genes identified
as up-regulated for multiple clusters, we only keep the belonging towards the
one they have the highest Log2FC value.
In the heatmap, there will always be a cell annotation for the cluster
labeling used when finding the markers, and a feature annotation for which
cluster each gene belongs to. And by default we split the heatmap by these
two annotations. Additional legends can be added and the splitting can be
canceled.
plotFindMarkerHeatmap(
  inSCE,
  orderBy = "size",
  log2fcThreshold = 1,
  fdrThreshold = 0.05,
  minClustExprPerc = 0.7,
  maxCtrlExprPerc = 0.4,
  minMeanExpr = 1,
  topN = 10,
  decreasing = TRUE,
  rowLabel = TRUE,
  rowDataName = NULL,
  colDataName = NULL,
  featureAnnotations = NULL,
  cellAnnotations = NULL,
  featureAnnotationColor = NULL,
  cellAnnotationColor = NULL,
  colSplitBy = NULL,
  rowSplitBy = "marker",
  rowDend = FALSE,
  colDend = FALSE,
  title = "Top Marker Heatmap",
  ...
)

plotMarkerDiffExp(
  inSCE,
  orderBy = "size",
  log2fcThreshold = 1,
  fdrThreshold = 0.05,
  minClustExprPerc = 0.7,
  maxCtrlExprPerc = 0.4,
  minMeanExpr = 1,
  topN = 10,
  decreasing = TRUE,
  rowDataName = NULL,
  colDataName = NULL,
  featureAnnotations = NULL,
  cellAnnotations = NULL,
  featureAnnotationColor = NULL,
  cellAnnotationColor = NULL,
  colSplitBy = NULL,
  rowSplitBy = "marker",
  rowDend = FALSE,
  colDend = FALSE,
  title = "Top Marker Heatmap",
  ...
)
Arguments
- inSCE
SingleCellExperiment inherited object.
- orderBy
The ordering method of the clusters on the splitted heatmap. Can be chosen from
"size"or"name", specified with vector of ordered unique cluster labels, or set asNULLfor unsplitted heatmap. Default"size".- log2fcThreshold
Only use DEGs with the absolute values of log2FC larger than this value. Default
1- fdrThreshold
Only use DEGs with FDR value smaller than this value. Default
0.05- minClustExprPerc
A numeric scalar. The minimum cutoff of the percentage of cells in the cluster of interests that expressed the marker gene. Default
0.7.- maxCtrlExprPerc
A numeric scalar. The maximum cutoff of the percentage of cells out of the cluster (control group) that expressed the marker gene. Default
0.4.- minMeanExpr
A numeric scalar. The minimum cutoff of the mean expression value of the marker in the cluster of interests. Default
1.- topN
An integer. Only to plot this number of top markers for each cluster in maximum, in terms of log2FC value. Use
NULLto cancel the top N subscription. Default10.- decreasing
Order the cluster decreasingly. Default
TRUE.- rowLabel
TRUEfor displayingrownamesofinSCE, arowDatavariable to use other feature identifiers, or a vector for customized row labels. UseFALSEfor not displaying. DefaultTRUE.- rowDataName
character. The column name(s) in
rowDatathat need to be added to the annotation. DefaultNULL.- colDataName
character. The column name(s) in
colDatathat need to be added to the annotation. DefaultNULL.- featureAnnotations
data.frame, withrownamescontaining all the features going to be plotted. Character columns should be factors. DefaultNULL.- cellAnnotations
data.frame, withrownamescontaining all the cells going to be plotted. Character columns should be factors. DefaultNULL.- featureAnnotationColor
A named list. Customized color settings for feature labeling. Should match the entries in the
featureAnnotationsorrowDataName. For each entry, there should be a list/vector of colors named with categories. DefaultNULL.- cellAnnotationColor
A named list. Customized color settings for cell labeling. Should match the entries in the
cellAnnotationsorcolDataName. For each entry, there should be a list/vector of colors named with categories. DefaultNULL.- colSplitBy
character vector. Do semi-heatmap based on the grouping of this(these) annotation(s). Should exist in either
colDataNameornames(cellAnnotations). Default is the value ofclusterinrunFindMarkerwhenorderByis notNULL, orNULLotherwise.- rowSplitBy
character vector. Do semi-heatmap based on the grouping of this(these) annotation(s). Should exist in either
rowDataNameornames(featureAnnotations). Default"marker", which indicates an auto generated annotation for this plot.- rowDend
Whether to display row dendrogram. Default
FALSE.- colDend
Whether to display column dendrogram. Default
FALSE.- title
Text of the title, at the top of the heatmap. Default
"Top Marker Heatmap".- ...
Other arguments passed to
plotSCEHeatmap.
Value
A Heatmap object
See also
Examples
data("sceBatches")
logcounts(sceBatches) <- log1p(counts(sceBatches))
sce.w <- subsetSCECols(sceBatches, colData = "batch == 'w'")
sce.w <- runFindMarker(sce.w, method = "wilcox", cluster = "cell_type")
#> Sat Mar 18 10:29:22 2023 ... Identifying markers for cluster 'beta', using DE method 'wilcox'
#> Sat Mar 18 10:29:22 2023 ... Identifying markers for cluster 'alpha', using DE method 'wilcox'
#> Sat Mar 18 10:29:22 2023 ... Organizing findMarker result
plotFindMarkerHeatmap(sce.w)