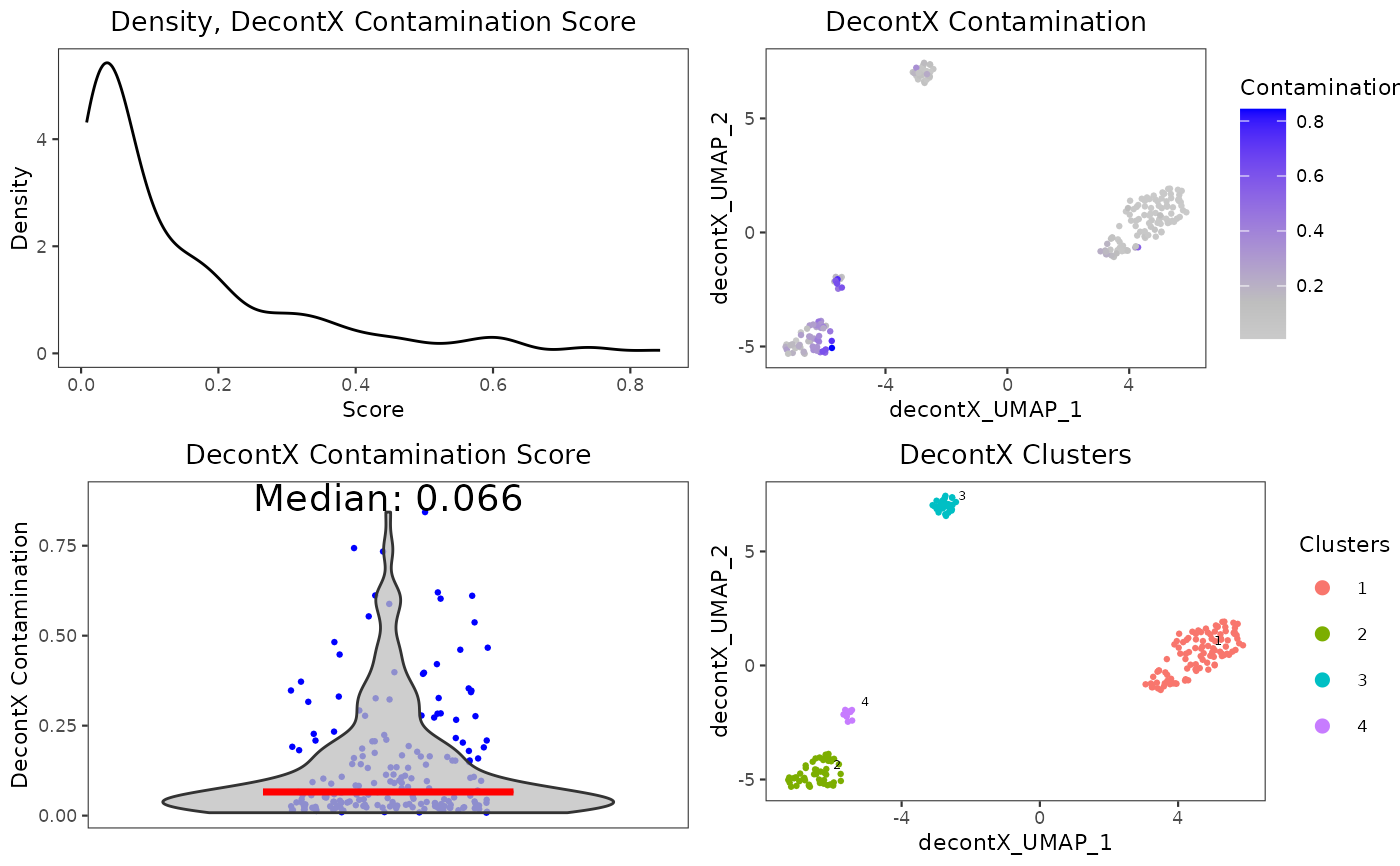
A wrapper function which visualizes outputs from the runDecontX function stored in the colData slot of the SingleCellExperiment object via various plots.
plotDecontXResults(
  inSCE,
  sample = NULL,
  bgResult = FALSE,
  shape = NULL,
  groupBy = NULL,
  combinePlot = "all",
  violin = TRUE,
  boxplot = FALSE,
  dots = TRUE,
  reducedDimName = "UMAP",
  xlab = NULL,
  ylab = NULL,
  dim1 = NULL,
  dim2 = NULL,
  bin = NULL,
  binLabel = NULL,
  defaultTheme = TRUE,
  dotSize = 0.5,
  summary = "median",
  summaryTextSize = 3,
  transparency = 1,
  baseSize = 15,
  titleSize = NULL,
  axisLabelSize = NULL,
  axisSize = NULL,
  legendSize = NULL,
  legendTitleSize = NULL,
  relHeights = 1,
  relWidths = c(1, 1, 1),
  plotNCols = NULL,
  plotNRows = NULL,
  labelSamples = TRUE,
  labelClusters = TRUE,
  clusterLabelSize = 3.5,
  samplePerColumn = TRUE,
  sampleRelHeights = 1,
  sampleRelWidths = 1
)
Arguments
- inSCE
Input SingleCellExperiment object with saved dimension reduction components or a variable with saved results from runDecontX. Required.
- sample
Character vector. Indicates which sample each cell belongs to. Default NULL.
- bgResult
Boolean. If TRUE, will plot decontX results generated with raw/droplet matrix Default FALSE.
- shape
If provided, add shapes based on the value.
- groupBy
Groupings for each numeric value. A user may input a vector equal length to the number of the samples in the SingleCellExperiment object, or can be retrieved from the colData slot. Default NULL.
- combinePlot
Must be either "all", "sample", or "none". "all" will combine all plots into a single .ggplot object, while "sample" will output a list of plots separated by sample. Default "all".
- violin
Boolean. If TRUE, will plot the violin plot. Default TRUE.
- boxplot
Boolean. If TRUE, will plot boxplots for each violin plot. Default TRUE.
- dots
Boolean. If TRUE, will plot dots for each violin plot. Default TRUE.
- reducedDimName
Saved dimension reduction name in the SingleCellExperiment object. Required. Default = "UMAP"
- xlab
Character vector. Label for x-axis. Default NULL.
- ylab
Character vector. Label for y-axis. Default NULL.
- dim1
1st dimension to be used for plotting. Can either be a string which specifies the name of the dimension to be plotted from reducedDims, or a numeric value which specifies the index of the dimension to be plotted. Default is NULL.
- dim2
2nd dimension to be used for plotting. Can either be a string which specifies the name of the dimension to be plotted from reducedDims, or a numeric value which specifies the index of the dimension to be plotted. Default is NULL.
- bin
Numeric vector. If single value, will divide the numeric values into the `bin` groups. If more than one value, will bin numeric values using values as a cut point.
- binLabel
Character vector. Labels for the bins created by the `bin` parameter. Default NULL.
- defaultTheme
Removes grid in plot and sets axis title size to 10 when TRUE. Default TRUE.
- dotSize
Size of dots. Default 0.5.
- summary
Adds a summary statistic, as well as a crossbar to the violin plot. Options are "mean" or "median". Default NULL.
- summaryTextSize
The text size of the summary statistic displayed above the violin plot. Default 3.
- transparency
Transparency of the dots, values will be 0-1. Default 1.
- baseSize
The base font size for all text. Default 12. Can be overwritten by titleSize, axisSize, and axisLabelSize, legendSize, legendTitleSize.
- titleSize
Size of title of plot. Default NULL.
- axisLabelSize
Size of x/y-axis labels. Default NULL.
- axisSize
Size of x/y-axis ticks. Default NULL.
- legendSize
size of legend. Default NULL.
- legendTitleSize
size of legend title. Default NULL.
- relHeights
Relative heights of plots when combine is set.
- relWidths
Relative widths of plots when combine is set.
- plotNCols
Number of columns when plots are combined in a grid.
- plotNRows
Number of rows when plots are combined in a grid.
- labelSamples
Will label sample name in title of plot if TRUE. Default TRUE.
- labelClusters
Logical. Whether the cluster labels are plotted. Default FALSE.
- clusterLabelSize
Numeric. Determines the size of cluster label when `labelClusters` is set to TRUE. Default 3.5.
- samplePerColumn
If TRUE, when there are multiple samples and combining by "all", the output .ggplot will have plots from each sample on a single column. Default TRUE.
- sampleRelHeights
If there are multiple samples and combining by "all", the relative heights for each plot.
- sampleRelWidths
If there are multiple samples and combining by "all", the relative widths for each plot.
Value
list of .ggplot objects
Examples
data(scExample, package="singleCellTK")
sce <- subsetSCECols(sce, colData = "type != 'EmptyDroplet'")
sce <- runDecontX(sce)
#> Sat Mar 18 10:28:49 2023 ... Running 'DecontX'
#> --------------------------------------------------
#> Starting DecontX
#> --------------------------------------------------
#> Sat Mar 18 10:28:49 2023 .. Analyzing all cells
#> Sat Mar 18 10:28:49 2023 .... Generating UMAP and estimating cell types
#> Sat Mar 18 10:28:52 2023 .... Estimating contamination
#> Sat Mar 18 10:28:52 2023 ...... Completed iteration: 10 | converge: 0.0278
#> Sat Mar 18 10:28:52 2023 ...... Completed iteration: 20 | converge: 0.01058
#> Sat Mar 18 10:28:52 2023 ...... Completed iteration: 30 | converge: 0.00584
#> Sat Mar 18 10:28:52 2023 ...... Completed iteration: 40 | converge: 0.004697
#> Sat Mar 18 10:28:52 2023 ...... Completed iteration: 50 | converge: 0.003356
#> Sat Mar 18 10:28:52 2023 ...... Completed iteration: 60 | converge: 0.002634
#> Sat Mar 18 10:28:52 2023 ...... Completed iteration: 70 | converge: 0.001941
#> Sat Mar 18 10:28:52 2023 ...... Completed iteration: 80 | converge: 0.001413
#> Sat Mar 18 10:28:52 2023 ...... Completed iteration: 90 | converge: 0.001284
#> Sat Mar 18 10:28:52 2023 ...... Completed iteration: 100 | converge: 0.00111
#> Sat Mar 18 10:28:52 2023 ...... Completed iteration: 104 | converge: 0.0009827
#> Sat Mar 18 10:28:52 2023 .. Calculating final decontaminated matrix
#> --------------------------------------------------
#> Completed DecontX. Total time: 2.851938 secs
#> --------------------------------------------------
plotDecontXResults(inSCE=sce, reducedDimName="decontX_UMAP")