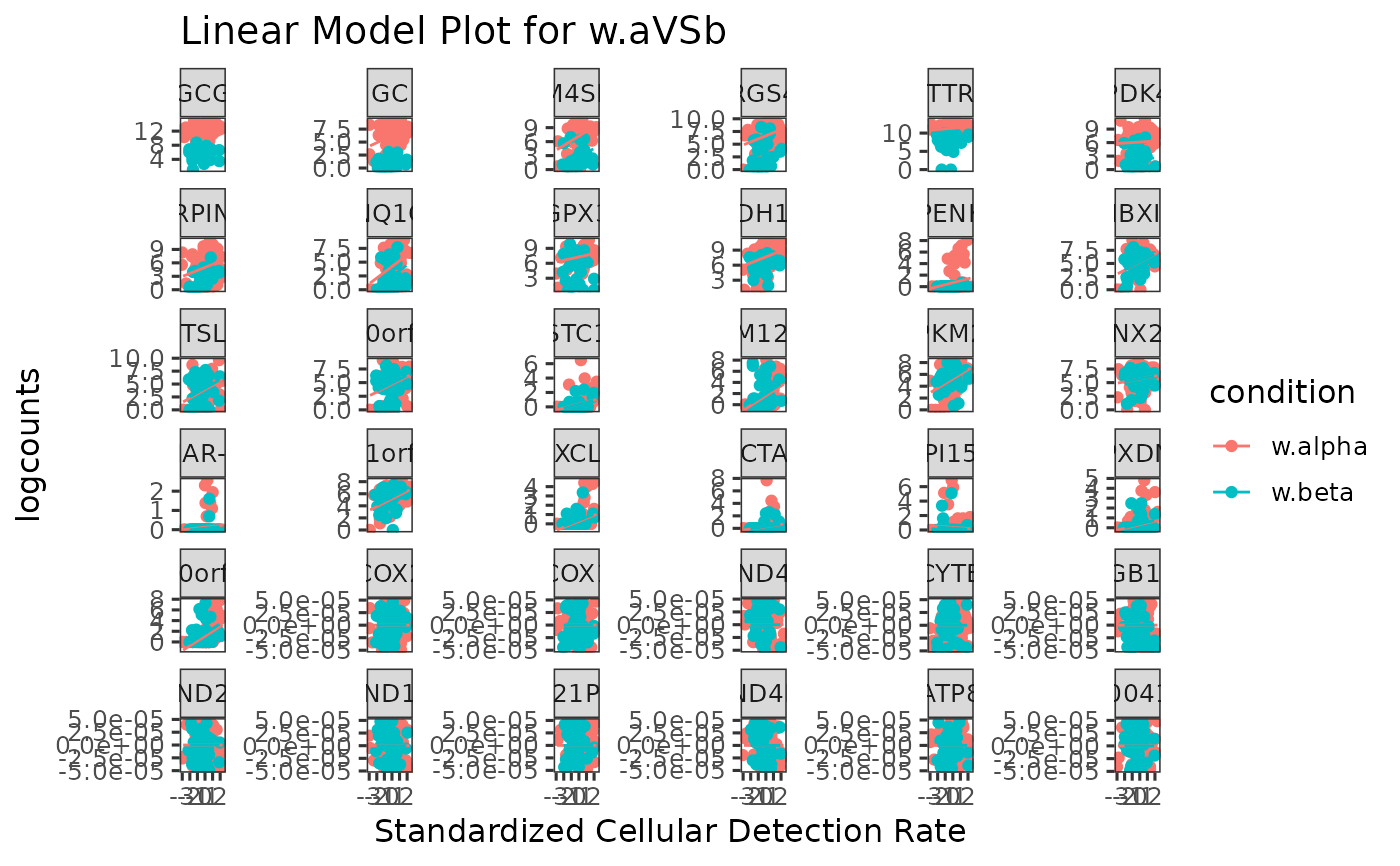
Create linear regression plot to show the expression the of top DEGs
Source:R/plotDEAnalysis.R
plotDEGRegression.RdCreate linear regression plot to show the expression the of top DEGs
plotDEGRegression(
  inSCE,
  useResult,
  threshP = FALSE,
  labelBy = NULL,
  nrow = 6,
  ncol = 6,
  defaultTheme = TRUE,
  isLogged = TRUE,
  check_sanity = TRUE
)
Arguments
- inSCE
SingleCellExperiment inherited object.
- useResult
character. A string specifying the
analysisNameused when running a differential expression analysis function.- threshP
logical. Whether to plot threshold values from adaptive thresholding, instead of using the assay used by when performing DE analysis. Default
FALSE.- labelBy
A single character for a column of
rowData(inSCE)as where to search for the labeling text. DefaultNULL.- nrow
Integer. Number of rows in the plot grid. Default
6.- ncol
Integer. Number of columns in the plot grid. Default
6.- defaultTheme
Logical scalar. Whether to use default SCTK theme in ggplot. Default
TRUE.- isLogged
Logical scalar. Whether the assay used for the analysis is logged. If not, will do a
log(assay + 1)transformation. DefaultTRUE.- check_sanity
Logical scalar. Whether to perform MAST's sanity check to see if the counts are logged. Default
TRUE
Value
A ggplot object of linear regression
Details
Any of the differential expression analysis method from SCTK should be performed prior to using this function
Examples
data("sceBatches")
logcounts(sceBatches) <- log1p(counts(sceBatches))
sce.w <- subsetSCECols(sceBatches, colData = "batch == 'w'")
sce.w <- runWilcox(sce.w, class = "cell_type", classGroup1 = "alpha",
                   groupName1 = "w.alpha", groupName2 = "w.beta",
                   analysisName = "w.aVSb")
#> Sat Mar 18 10:28:41 2023 ... Running DE with wilcox, Analysis name: w.aVSb
plotDEGRegression(sce.w, "w.aVSb")