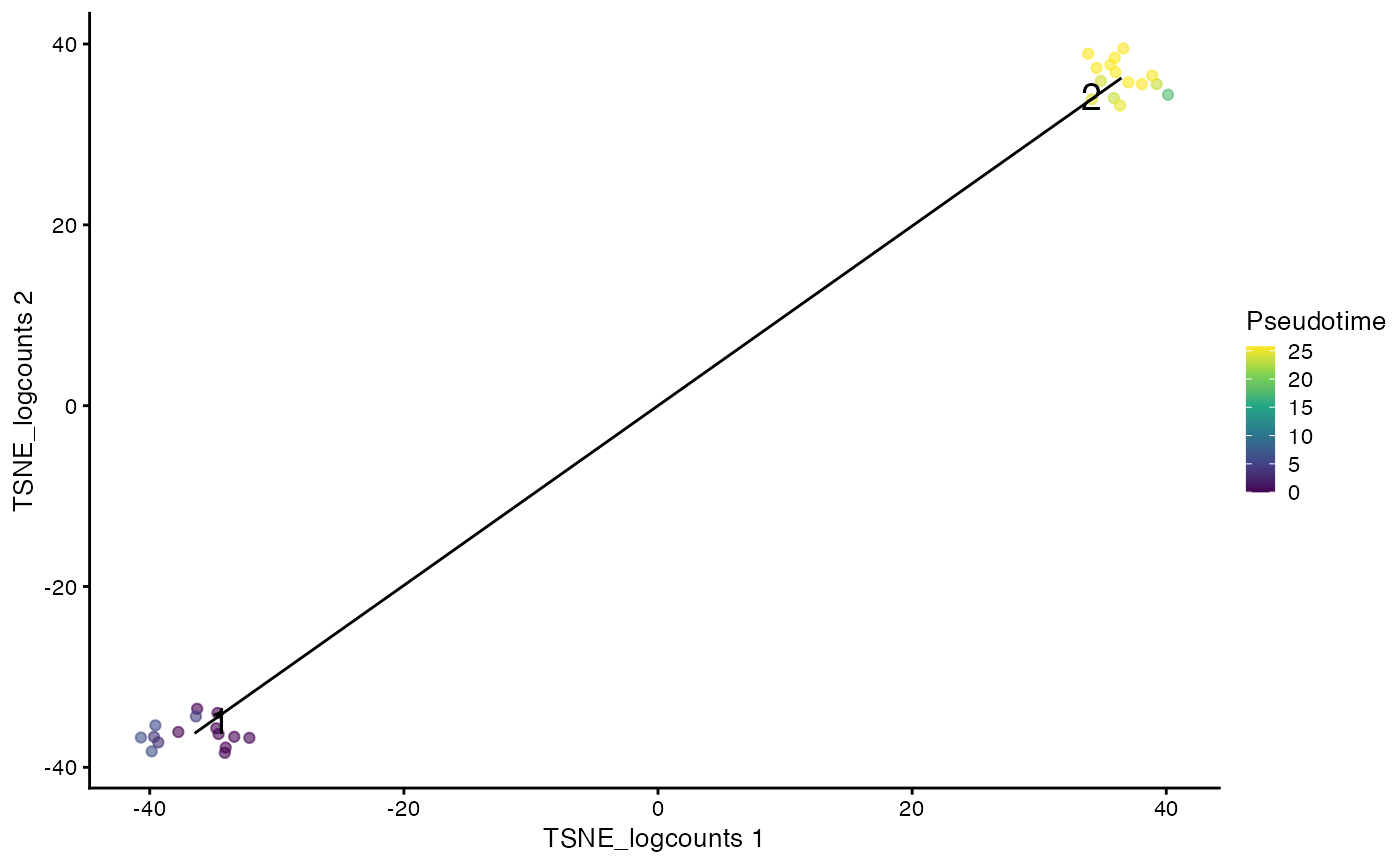
A wrapper function which visualizes outputs from the
runTSCAN function. Plots the pseudotime ordering of the cells
and project them onto the MST.
plotTSCANResults(inSCE, useReducedDim = "UMAP")Arguments
- inSCE
Input SingleCellExperiment object.
- useReducedDim
Saved dimension reduction name in
inSCEobject. Required.
Value
A .ggplot object with the pseudotime ordering of the cells
colored on a cell 2D embedding, and the MST path drawn on it.
Examples
data("mouseBrainSubsetSCE", package = "singleCellTK")
mouseBrainSubsetSCE <- runTSCAN(inSCE = mouseBrainSubsetSCE,
                                useReducedDim = "PCA_logcounts")
#> Fri May  3 07:17:29 2024 ... Running 'scran SNN clustering' with 'louvain' algorithm
#> Fri May  3 07:17:30 2024 ...   Identified 2 clusters
#> Fri May  3 07:17:30 2024 ... Running TSCAN to estimate pseudotime
#> Fri May  3 07:17:30 2024 ...   Clusters involved in path index 2 are: 1, 2
#> Fri May  3 07:17:30 2024 ...   Number of estimated paths is 1
plotTSCANResults(inSCE = mouseBrainSubsetSCE,
                 useReducedDim = "TSNE_logcounts")
#> Scale for colour is already present.
#> Adding another scale for colour, which will replace the existing scale.
