Plot highly variable genes
plotTopHVG(
  inSCE,
  method = c("vst", "mean.var.plot", "dispersion", "modelGeneVar"),
  hvgNumber = NULL,
  useFeatureSubset = NULL,
  labelsCount = 20,
  featureDisplay = metadata(inSCE)$featureDisplay
)
Arguments
- inSCE
Input
SingleCellExperimentobject containing the computations.- method
Select either
"vst","mean.var.plot","dispersion"or"modelGeneVar".- hvgNumber
Specify the number of top genes to highlight in red. Default
NULL. See details.- useFeatureSubset
A character string for the
rowDatavariable name to store a logical index of selected features. DefaultNULL. See details.- labelsCount
Specify the number of data points/genes to label. Should be less than
hvgNumber. Default20. See details.- featureDisplay
A character string for the
rowDatavariable name to indicate what type of feature ID should be displayed. If set bysetSCTKDisplayRow, will by default use it. IfNULL, will userownames(inSCE).
Value
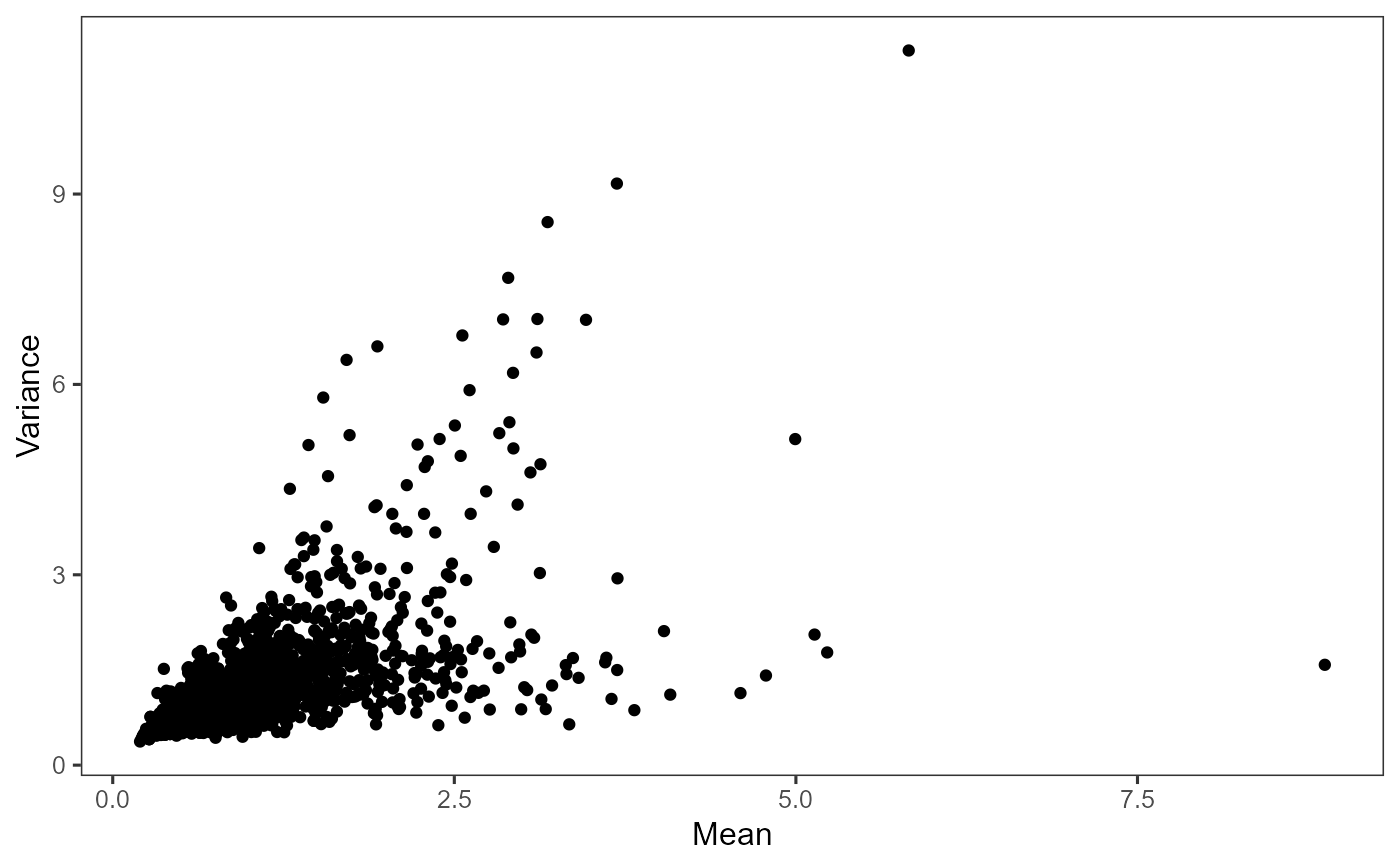
ggplot of HVG metrics and top HVG labels
Details
When hvgNumber = NULL and useFeature = NULL, only plot
the mean VS variance/dispersion scatter plot. When only hvgNumber set,
label the top hvgNumber HVGs ranked by the metrics calculated by
method. When useFeatureSubset set, label the features in
the subset on the scatter plot created with method and ignore
hvgNumber.
See also
Examples
data("mouseBrainSubsetSCE", package = "singleCellTK")
mouseBrainSubsetSCE <- runModelGeneVar(mouseBrainSubsetSCE)
#> Warning: collapsing to unique 'x' values
plotTopHVG(mouseBrainSubsetSCE, method = "modelGeneVar")