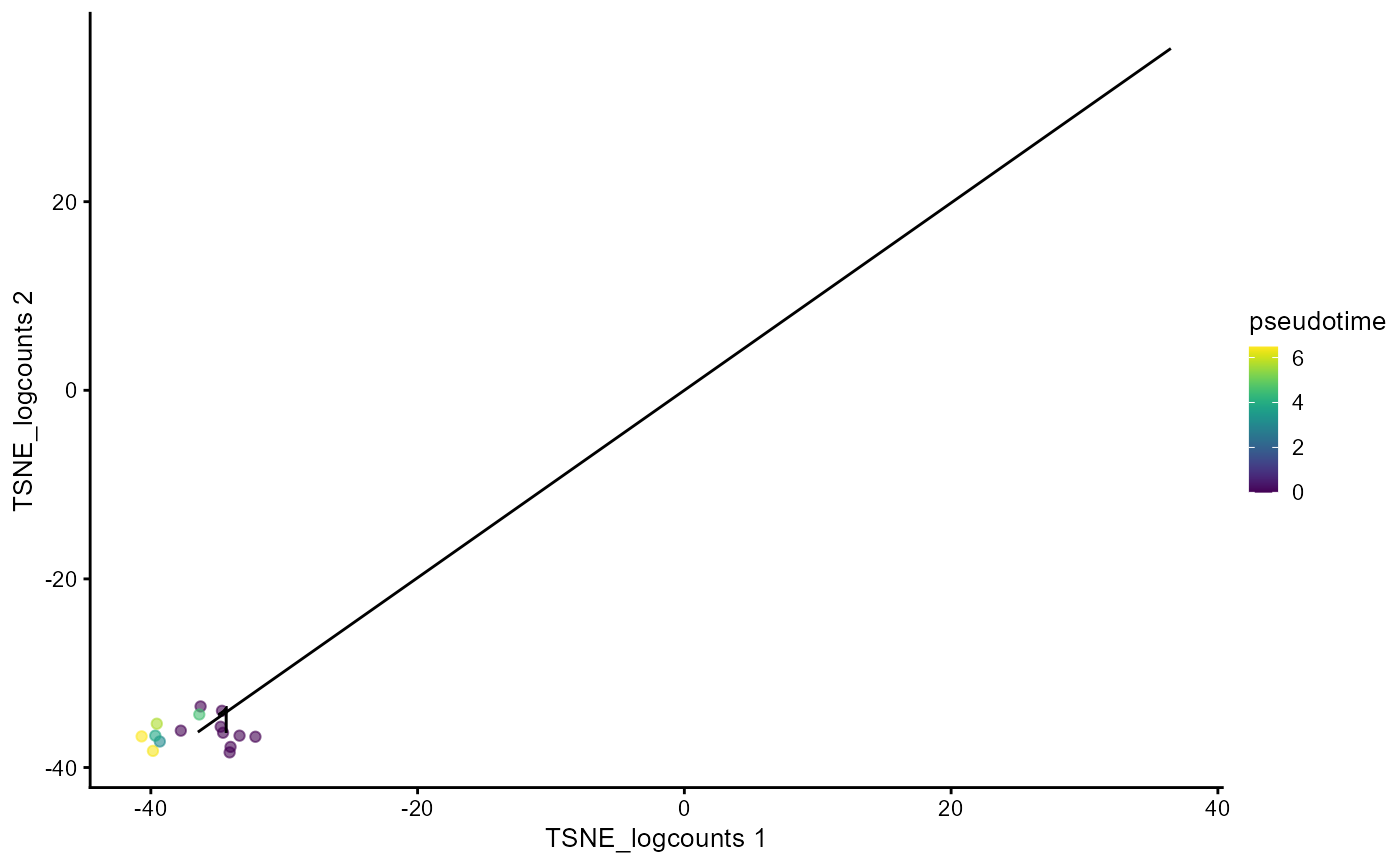
This function finds all paths that root from a given cluster
useCluster. For each path, this function plots the recomputed
pseudotime starting from the root on a scatter plot which contains cells only
in this cluster. MST has to be pre-calculated with runTSCAN.
plotTSCANClusterPseudo(
  inSCE,
  useCluster,
  useReducedDim = "UMAP",
  combinePlot = c("all", "none")
)
Arguments
- inSCE
Input SingleCellExperiment object.
- useCluster
The cluster to be regarded as the root, has to existing in
colData(inSCE)$TSCAN_clusters.- useReducedDim
Saved dimension reduction name in the SingleCellExperiment object. Required.
- combinePlot
Must be either
"all"or"none"."all"will combine plots of pseudotime along each path into a single.ggplotobject, while"none"will output a list of plots. Default"all".
Value
- combinePlot = "all"
A
.ggplotobject- combinePlot = "none"
A list of
.ggplot
Examples
data("mouseBrainSubsetSCE", package = "singleCellTK")
mouseBrainSubsetSCE <- runTSCAN(inSCE = mouseBrainSubsetSCE,
                                useReducedDim = "PCA_logcounts")
#> Tue Jun 28 22:05:56 2022 ... Running 'scran SNN clustering' with 'louvain' algorithm
#> Tue Jun 28 22:05:57 2022 ...   Identified 2 clusters
#> Tue Jun 28 22:05:57 2022 ... Running TSCAN to estimate pseudotime
#> Tue Jun 28 22:05:57 2022 ...   Clusters involved in path index 2 are: 1, 2
#> Tue Jun 28 22:05:57 2022 ...   Number of estimated paths is 1
plotTSCANClusterPseudo(mouseBrainSubsetSCE, useCluster = 1,
                       useReducedDim = "TSNE_logcounts")
#> Warning: Removed 1 rows containing missing values (geom_text_repel).
