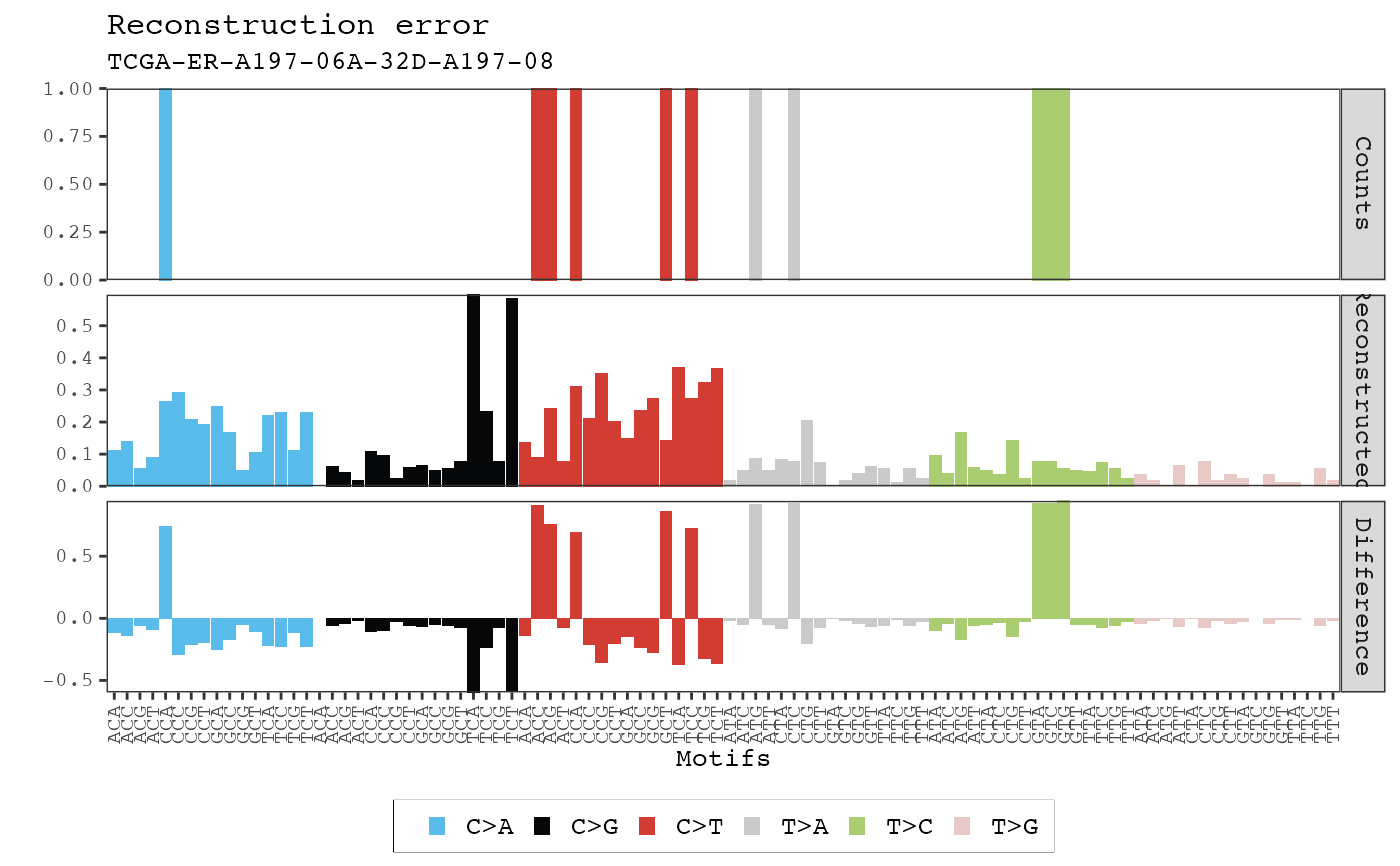
Displays the observed distribution of counts for each mutation type, the distribution of reconstructed counts for each mutation type using the inferred mutational signatures, and the difference between the two distributions.
plot_sample_reconstruction_error(result, sample, plotly = FALSE)
Arguments
| result | A |
|---|---|
| sample | Name of the sample within the
|
| plotly | If |
Value
Generates a ggplot or plotly object