Display sample exposures with bar, box, or violin plots
Source:R/plot_exposures.R
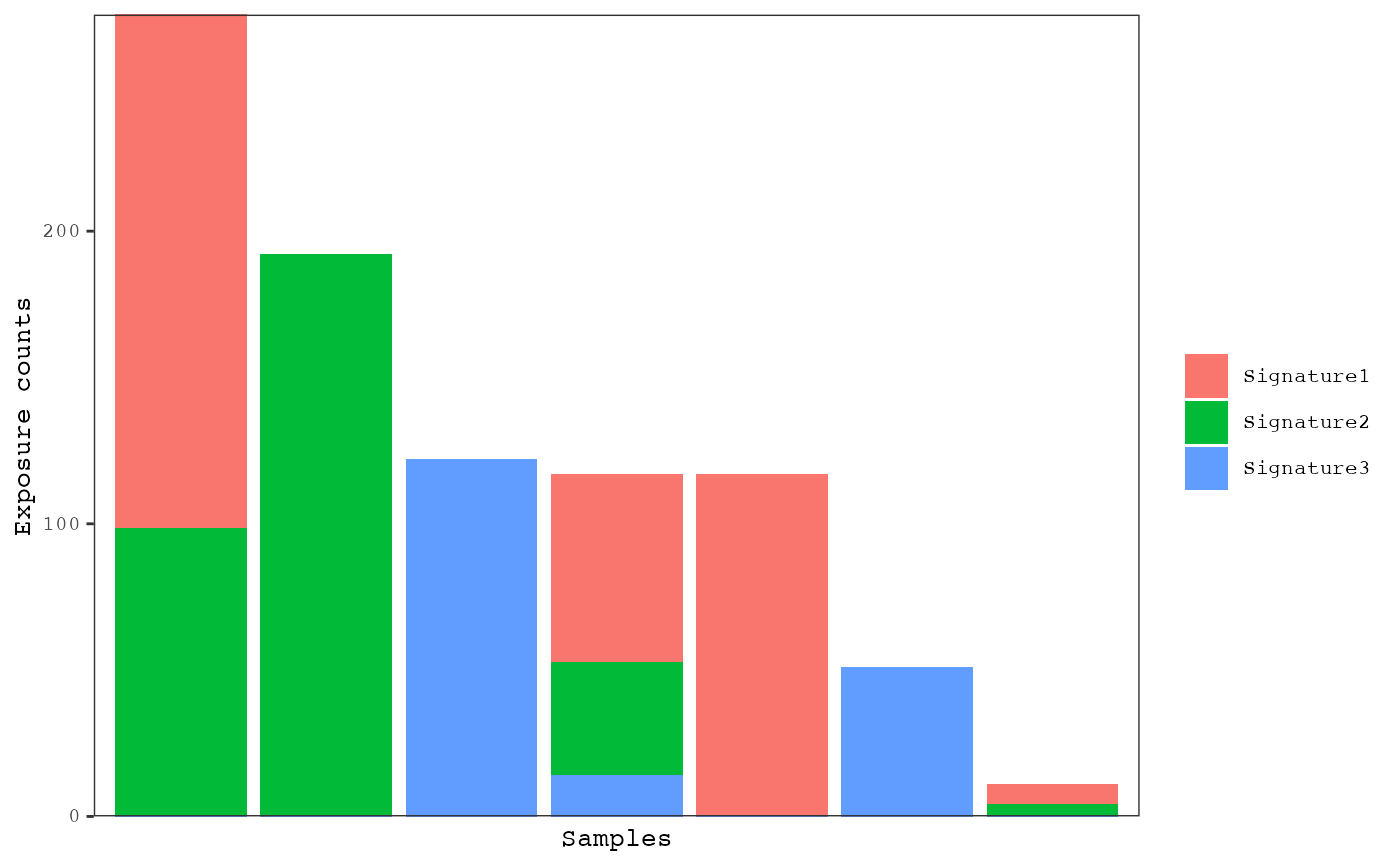
plot_exposures.RdThe distributions of mutational signatures can be viewed
with barplots or box/violin plots. Barplots are most useful for viewing
the proportion of signatures within and across samples. The box/violin plots
are most useful for viewing the distributions of signatures with respect to
sample annotations. Samples can be grouped using the group_by
parameter. For barplots, various methods of sorting samples from left
to right can be chosen using the sort_samples parameter.
plot_exposures(
  result,
  plot_type = c("bar", "box", "violin"),
  proportional = FALSE,
  group_by = "none",
  color_by = c("signature", "annotation"),
  annotation = NULL,
  num_samples = NULL,
  sort_samples = "total",
  threshold = NULL,
  same_scale = FALSE,
  add_points = FALSE,
  point_size = 2,
  label_x_axis = FALSE,
  legend = TRUE,
  plotly = FALSE
)
Arguments
| result | A |
|---|---|
| plot_type | One of |
| proportional | If |
| group_by | Determines how to group samples into the subplots
(i.e. facets). One of |
| color_by | Determines how to color the bars or box/violins. One of
|
| annotation | Sample annotation used to group the subplots and/or
color the bars, boxes, or violins. Default |
| num_samples | The top number of sorted samples to display. If
|
| sort_samples | This is used to change how samples are sorted in
the barplot from left to right. If set to |
| threshold | Exposures less than this threshold will be set to 0.
This is most useful when more than one signature is supplied to
|
| same_scale | If |
| add_points | If |
| point_size | Size of the points to be plotted on top of the
violin/box plots. Only used when |
| label_x_axis | If |
| legend | If |
| plotly | If |
Value
Generates a ggplot or plotly object