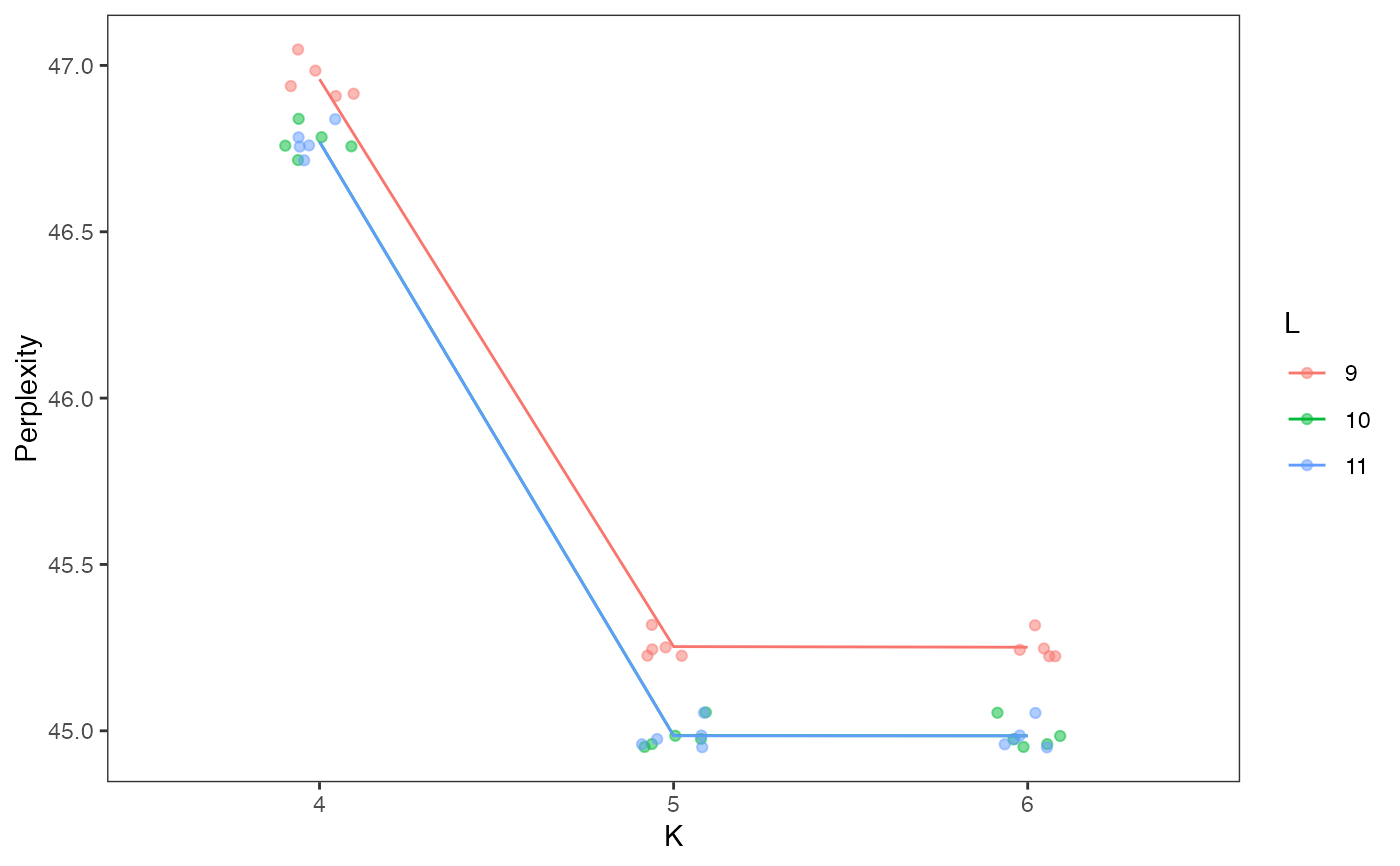
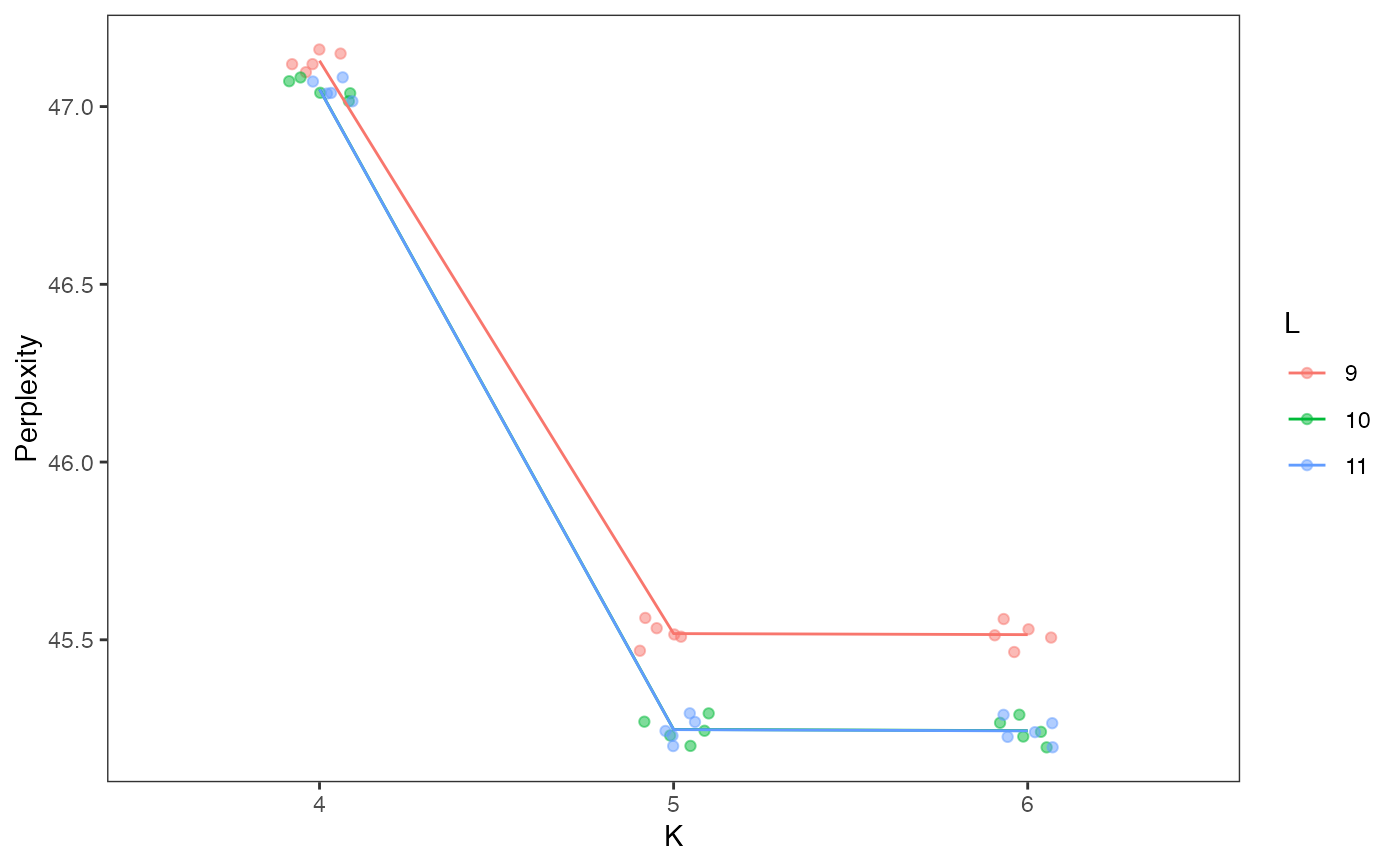
Visualize perplexity of every model in a celdaList, by unique K/L combinations
plotGridSearchPerplexity(x, altExpName = "featureSubset", sep = 1, alpha = 0.5)

# S4 method for SingleCellExperiment
plotGridSearchPerplexity(x, altExpName = "featureSubset", sep = 1, alpha = 0.5)

# S4 method for celdaList
plotGridSearchPerplexity(x, sep = 1, alpha = 0.5)
Arguments
| x | Can be one of
|
|---|---|
| altExpName | The name for the altExp slot
to use. Default "featureSubset". Only works if |
| sep | Numeric. Breaks in the x axis of the resulting plot. |
| alpha | Numeric. Passed to geom_jitter. Opacity of the points. Values of alpha range from 0 to 1, with lower values corresponding to more transparent colors. |
Value
A ggplot plot object showing perplexity as a function of clustering parameters.
Examples
data(sceCeldaCGGridSearch) sce <- resamplePerplexity(sceCeldaCGGridSearch) plotGridSearchPerplexity(sce)data(celdaCGSim, celdaCGGridSearchRes) ## Run various combinations of parameters with 'celdaGridSearch' celdaCGGridSearchRes <- resamplePerplexity( celdaCGSim$counts, celdaCGGridSearchRes) plotGridSearchPerplexity(celdaCGGridSearchRes)