Plotting feature expression on a dimension reduction plot
Source:R/plot_dr.R
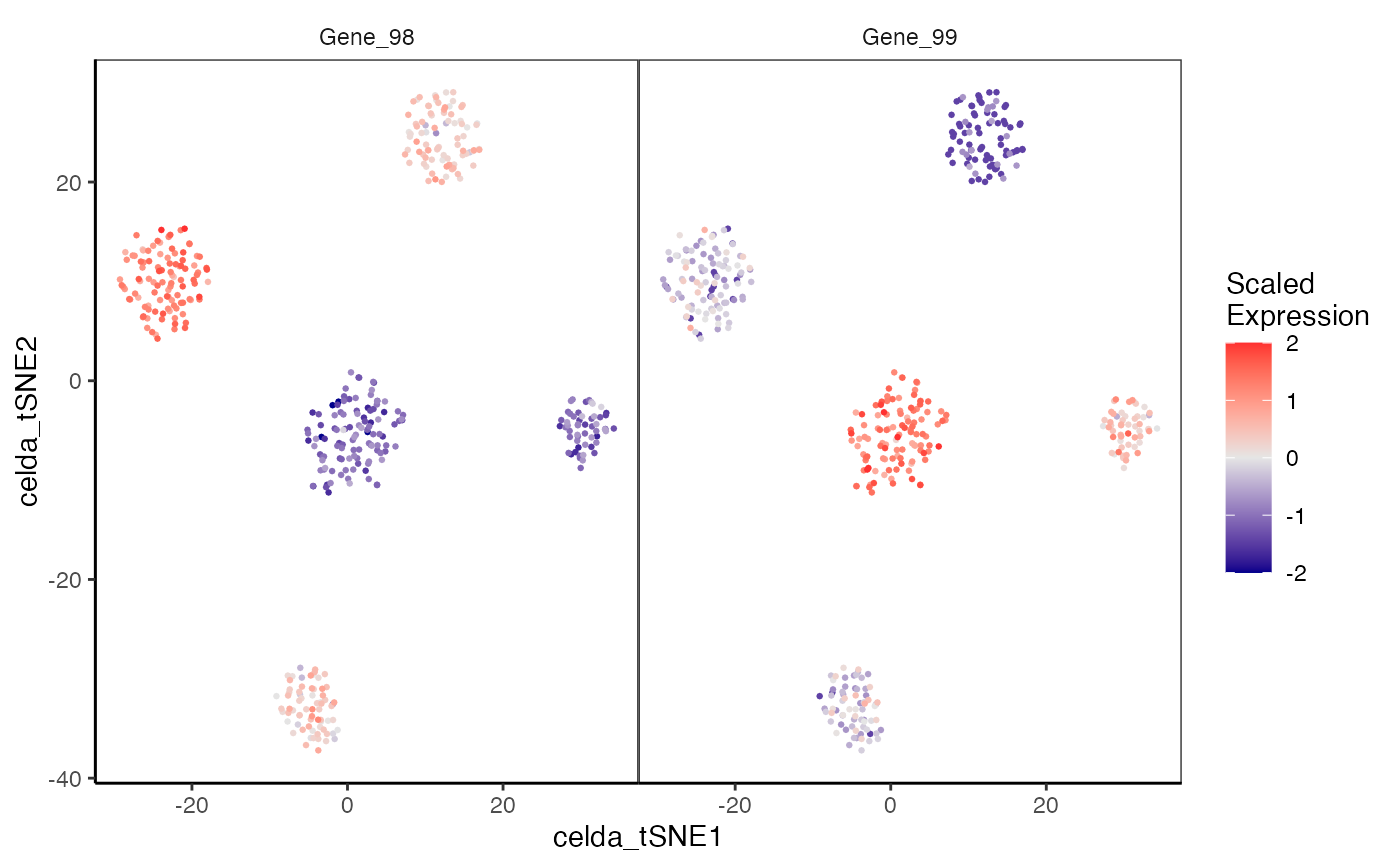
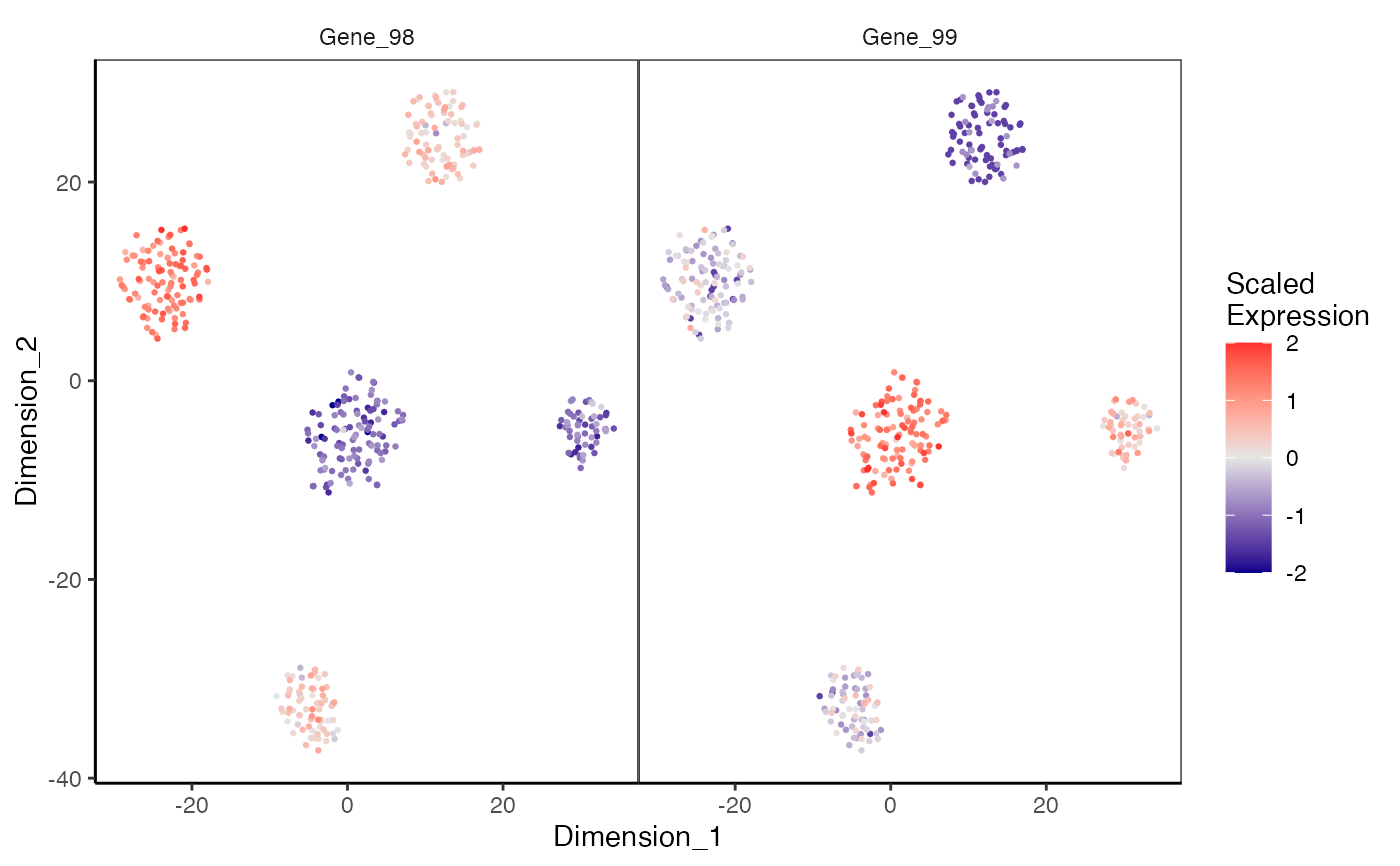
plotDimReduceFeature.RdCreate a scatterplot for each row of a normalized gene expression matrix where x and y axis are from a data dimension reduction tool. The cells are colored by expression of the specified feature.
plotDimReduceFeature(
  x,
  features,
  reducedDimName = NULL,
  displayName = NULL,
  dim1 = NULL,
  dim2 = NULL,
  headers = NULL,
  useAssay = "counts",
  altExpName = "featureSubset",
  normalize = FALSE,
  zscore = TRUE,
  exactMatch = TRUE,
  trim = c(-2, 2),
  limits = c(-2, 2),
  size = 0.5,
  xlab = NULL,
  ylab = NULL,
  colorLow = "blue4",
  colorMid = "grey90",
  colorHigh = "firebrick1",
  midpoint = 0,
  ncol = NULL,
  decreasing = FALSE
)

# S4 method for SingleCellExperiment
plotDimReduceFeature(
  x,
  features,
  reducedDimName = NULL,
  displayName = NULL,
  dim1 = 1,
  dim2 = 2,
  headers = NULL,
  useAssay = "counts",
  altExpName = "featureSubset",
  normalize = FALSE,
  zscore = TRUE,
  exactMatch = TRUE,
  trim = c(-2, 2),
  limits = c(-2, 2),
  size = 0.5,
  xlab = NULL,
  ylab = NULL,
  colorLow = "blue4",
  colorMid = "grey90",
  colorHigh = "firebrick1",
  midpoint = 0,
  ncol = NULL,
  decreasing = FALSE
)

# S4 method for ANY
plotDimReduceFeature(
  x,
  features,
  dim1,
  dim2,
  headers = NULL,
  normalize = FALSE,
  zscore = TRUE,
  exactMatch = TRUE,
  trim = c(-2, 2),
  limits = c(-2, 2),
  size = 0.5,
  xlab = "Dimension_1",
  ylab = "Dimension_2",
  colorLow = "blue4",
  colorMid = "grey90",
  colorHigh = "firebrick1",
  midpoint = 0,
  ncol = NULL,
  decreasing = FALSE
)
Arguments
| x | Numeric matrix or a SingleCellExperiment object
with the matrix located in the assay slot under |
|---|---|
| features | Character vector. Features in the rownames of counts to plot. |
| reducedDimName | The name of the dimension reduction slot in
|
| displayName | Character. The column name of
|
| dim1 | Integer or numeric vector. If |
| dim2 | Integer or numeric vector. If |
| headers | Character vector. If |
| useAssay | A string specifying which assay
slot to use if |
| altExpName | The name for the altExp slot to use. Default "featureSubset". |
| normalize | Logical. Whether to normalize the columns of `counts`.
Default |
| zscore | Logical. Whether to scale each feature to have a mean 0
and standard deviation of 1. Default |
| exactMatch | Logical. Whether an exact match or a partial match using
|
| trim | Numeric vector. Vector of length two that specifies the lower
and upper bounds for the data. This threshold is applied after row scaling.
Set to NULL to disable. Default |
| limits | Passed to scale_colour_gradient2. The range of color scale. |
| size | Numeric. Sets size of point on plot. Default 1. |
| xlab | Character vector. Label for the x-axis. If |
| ylab | Character vector. Label for the y-axis. If |
| colorLow | Character. A color available from `colors()`. The color will be used to signify the lowest values on the scale. |
| colorMid | Character. A color available from `colors()`. The color will be used to signify the midpoint on the scale. |
| colorHigh | Character. A color available from `colors()`. The color will be used to signify the highest values on the scale. |
| midpoint | Numeric. The value indicating the midpoint of the
diverging color scheme. If |
| ncol | Integer. Passed to facet_wrap. Specify the number of columns for facet wrap. |
| decreasing | logical. Specifies the order of plotting the points.
If |
Value
The plot as a ggplot object
Examples
data(sceCeldaCG) sce <- celdaTsne(sceCeldaCG) plotDimReduceFeature(x = sce, reducedDimName = "celda_tSNE", normalize = TRUE, features = c("Gene_98", "Gene_99"), exactMatch = TRUE)library(SingleCellExperiment) data(sceCeldaCG) sce <- celdaTsne(sceCeldaCG) plotDimReduceFeature(x = counts(sce), dim1 = reducedDim(altExp(sce), "celda_tSNE")[, 1], dim2 = reducedDim(altExp(sce), "celda_tSNE")[, 2], normalize = TRUE, features = c("Gene_98", "Gene_99"), exactMatch = TRUE)