Create a scatterplot for each row of a normalized
gene expression matrix where x and y axis are from a
data dimension reduction tool.
The cells are colored by "celda_cell_cluster" column in
colData(altExp(x, altExpName)) if x is a
SingleCellExperiment object, or x if x is
a integer vector of cell cluster labels.
plotDimReduceCluster(
  x,
  reducedDimName,
  altExpName = "featureSubset",
  dim1 = NULL,
  dim2 = NULL,
  size = 0.5,
  xlab = NULL,
  ylab = NULL,
  specificClusters = NULL,
  labelClusters = FALSE,
  groupBy = NULL,
  labelSize = 3.5
)

# S4 method for SingleCellExperiment
plotDimReduceCluster(
  x,
  reducedDimName,
  altExpName = "featureSubset",
  dim1 = 1,
  dim2 = 2,
  size = 0.5,
  xlab = NULL,
  ylab = NULL,
  specificClusters = NULL,
  labelClusters = FALSE,
  groupBy = NULL,
  labelSize = 3.5
)

# S4 method for vector
plotDimReduceCluster(
  x,
  dim1,
  dim2,
  size = 0.5,
  xlab = "Dimension_1",
  ylab = "Dimension_2",
  specificClusters = NULL,
  labelClusters = FALSE,
  groupBy = NULL,
  labelSize = 3.5
)
Arguments
| x | Integer vector of cell cluster labels or a
SingleCellExperiment object
containing cluster labels for each cell in |
|---|---|
| reducedDimName | The name of the dimension reduction slot in
|
| altExpName | The name for the altExp slot to use. Default "featureSubset". |
| dim1 | Integer or numeric vector. If |
| dim2 | Integer or numeric vector. If |
| size | Numeric. Sets size of point on plot. Default |
| xlab | Character vector. Label for the x-axis. Default |
| ylab | Character vector. Label for the y-axis. Default |
| specificClusters | Numeric vector.
Only color cells in the specified clusters.
All other cells will be grey.
If NULL, all clusters will be colored. Default |
| labelClusters | Logical. Whether the cluster labels are plotted. Default FALSE. |
| groupBy | Character vector. Contains sample labels for each cell. If NULL, all samples will be plotted together. Default NULL. |
| labelSize | Numeric. Sets size of label if labelClusters is TRUE. Default 3.5. |
Value
The plot as a ggplot object
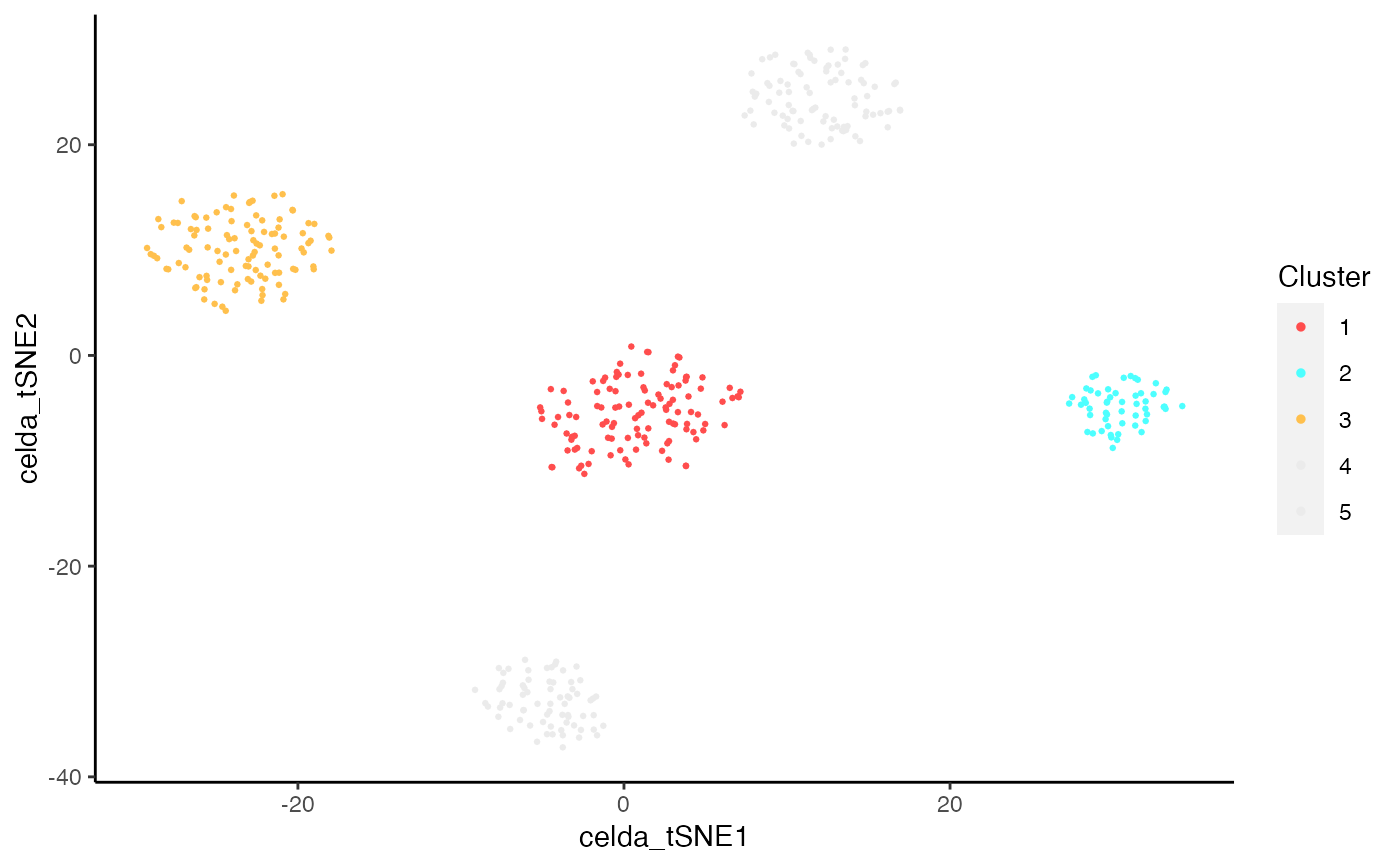
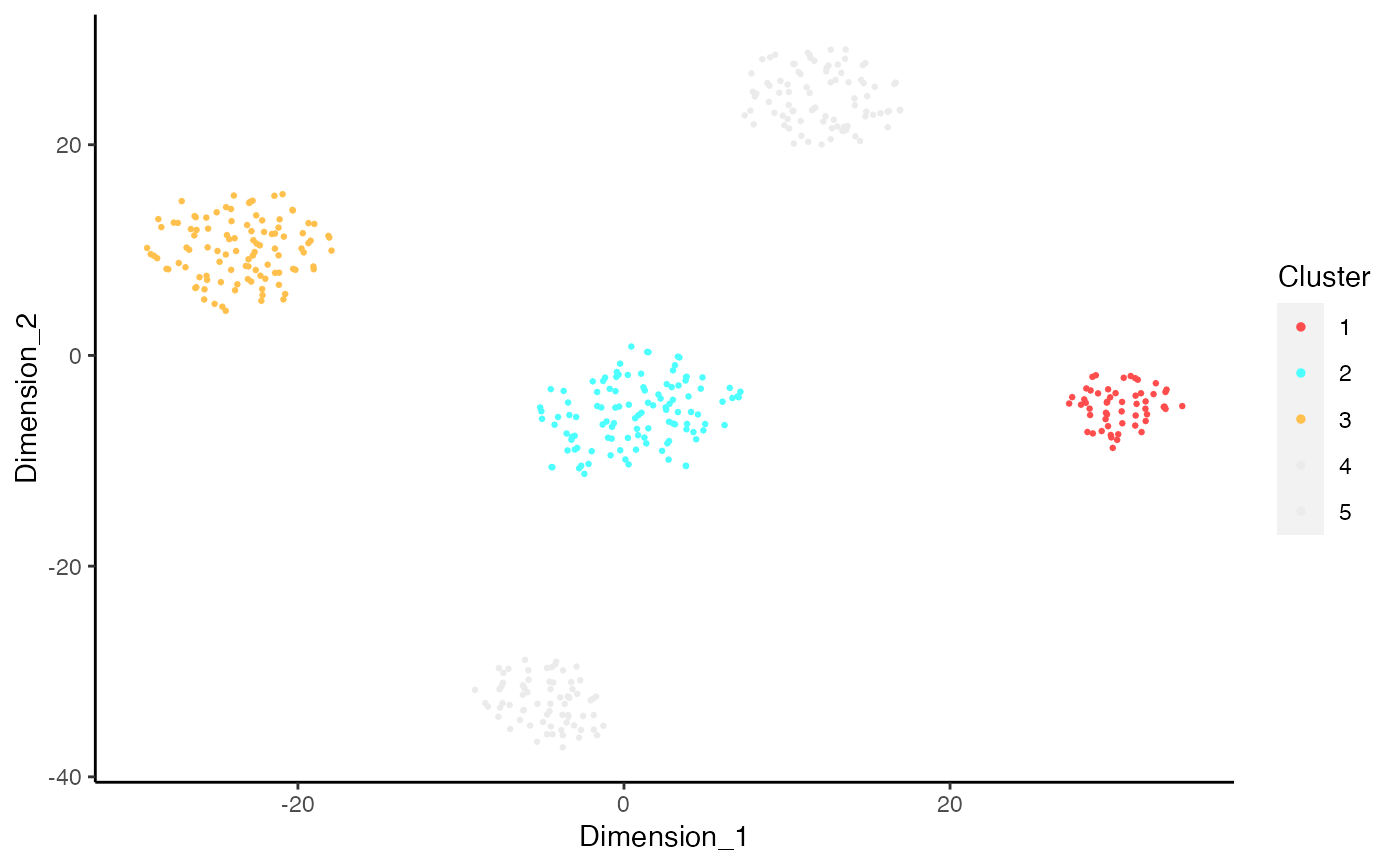
Examples
data(sceCeldaCG) sce <- celdaTsne(sceCeldaCG) plotDimReduceCluster(x = sce, reducedDimName = "celda_tSNE", specificClusters = c(1, 2, 3))library(SingleCellExperiment) data(sceCeldaCG, celdaCGMod) sce <- celdaTsne(sceCeldaCG) plotDimReduceCluster(x = celdaClusters(celdaCGMod)$z, dim1 = reducedDim(altExp(sce), "celda_tSNE")[, 1], dim2 = reducedDim(altExp(sce), "celda_tSNE")[, 2], specificClusters = c(1, 2, 3))